


Retail Pricing Analytics: How Hardware-Enabled Data Turns Physical Stores into Smarter Businesses
Imagine you run 5,000 SKUs across 20 stores. Your biggest competitor adjusts prices at 3 p.m. You find out three days later, when a customer shows you a screenshot. This is not a hypothetical. This is the daily reality for most brick-and-mortar retailers, and it explains why retail pricing analytics has moved from a “nice-to-have” to an operational necessity.
But here is what most guides miss: pricing analytics in physical retail is not just a software problem. It is a hardware problem first. You cannot analyze what you cannot measure, and you cannot measure what still lives on paper tags and weekly spreadsheets.
What Is Retail Pricing Analytics?
Retail pricing analytics is the systematic process of collecting, analyzing, and acting on pricing data to determine how price decisions affect sales volume, profit margins, and customer behavior. The goal is straightforward: find the optimal price that maximizes revenue without driving buyers away, and do it before market conditions shift.
The discipline has evolved through four distinct eras. Before 2010, pricing was intuition-driven. Senior merchants set prices based on experience and gut feel. The 2010s brought rule-based tools and ecommerce repricing engines. Between 2021 and 2024, machine learning entered the picture, allowing retailers to model demand and competition with increasing accuracy. Now, in 2026, the conversation has moved to predictive pricing intelligence. The shift is from “react faster” to “predict smarter,” with AI surfacing recommendations that human teams review and approve.
The numbers behind this shift are substantial. The global AI-in-retail market reached approximately $18.4 billion in 2026 (Coherent Market Insights), with pricing optimization ranking among the top three applications alongside demand forecasting and personalized recommendations. The question is no longer whether to adopt data-driven pricing. The question is whether your stores have the data infrastructure to make it work.
The Data Problem: Why Physical Retail Lags Behind Ecommerce
Ecommerce pricing analytics operates on a simple premise: every click, every cart abandonment, every session duration is a real-time signal. An online retailer’s pricing model can update hourly, sometimes by the minute, because the data pipeline is native to the platform.
Physical retail faces the opposite reality. The shelf is still, in most stores, a data desert.
The Blind Spot: What Physical Retail Cannot See
Contrast the two environments. An ecommerce operator sees exactly how many visitors viewed a product page, how many added it to cart, and how many completed purchase — all within the same hour. A store manager sees what sold at the end of the day, sometimes at the end of the week. There is no visibility into how many shoppers picked up an item, compared it to alternatives, and put it back. There is no signal on whether a competitor across the street just dropped their price by 15%.

This data asymmetry matters enormously. Physical retail still accounts for roughly 85% of total retail sales globally, yet it operates with the least granular pricing data of any channel. The core paradox: the channel that generates the most revenue has the weakest analytical foundation. When your pricing data arrives in weekly batches while your competitors adjust hourly, you are not making decisions. You are documenting history.
The Real-World Consequences of the Data Gap
This is not an abstract inefficiency. It produces three concrete, measurable problems for retailers.
First, promotional waste at scale. Industry data consistently shows that approximately two-thirds of retail promotions fail to generate positive ROI. Discounts are set based on last season’s performance, or worse, on what competitors appeared to be doing weeks ago. Without real-time feedback on promotion effectiveness, retailers burn margin on markdowns that do not move inventory.
Second, shelf-to-checkout price discrepancies. When prices live on paper tags updated by store staff, error rates typically range from 2% to 5%. A customer sees $8.99 on the shelf and gets charged $9.49 at the register. Reddit communities like r/Anticonsumption have documented cases where consumers used price-tracking tools to catch major retailers inflating pre-sale prices, then “discounting” items back to their original levels. One widely shared incident involved a Home Depot display where a drill kit was marked “on sale” for $139, but a hidden tag underneath revealed a pre-sale price of $119. The reputational damage from a single viral post often exceeds the margin gained from the pricing tactic itself.
Third, profit leakage through uninformed pricing. Without price elasticity data — that is, understanding how sensitive your customers are to price changes on specific items — retailers routinely leave money on the table. Products that could sustain a price increase stay underpriced. Products that need a markdown to clear shelf space sit stagnant. Both errors compound across hundreds of SKUs and multiple locations.
How IoT Hardware Closes the Data Loop: ESLs as the Missing Link
If the problem is that physical shelves generate no data, the solution requires hardware that turns every shelf edge into a data node. This is where electronic shelf labels (ESLs) move from “digital price tags” to strategic infrastructure.
The most common misconception about ESLs is that they simply replace paper. That underestimates them. A properly deployed ESL system is an IoT network that simultaneously collects shelf-level data, executes pricing decisions in real time, and feeds operational intelligence back into the analytics engine. It is the physical-world equivalent of the data pipeline that ecommerce platforms take for granted.
Real-Time Data Collection at the Shelf Edge
Modern ESLs are two-way devices. When headquarters pushes a price update, each label confirms receipt and execution back to the central system. This bidirectional communication creates something physical retail has never had before: a real-time audit trail of exactly which prices are live, at which stores, at which shelves, at which moment.
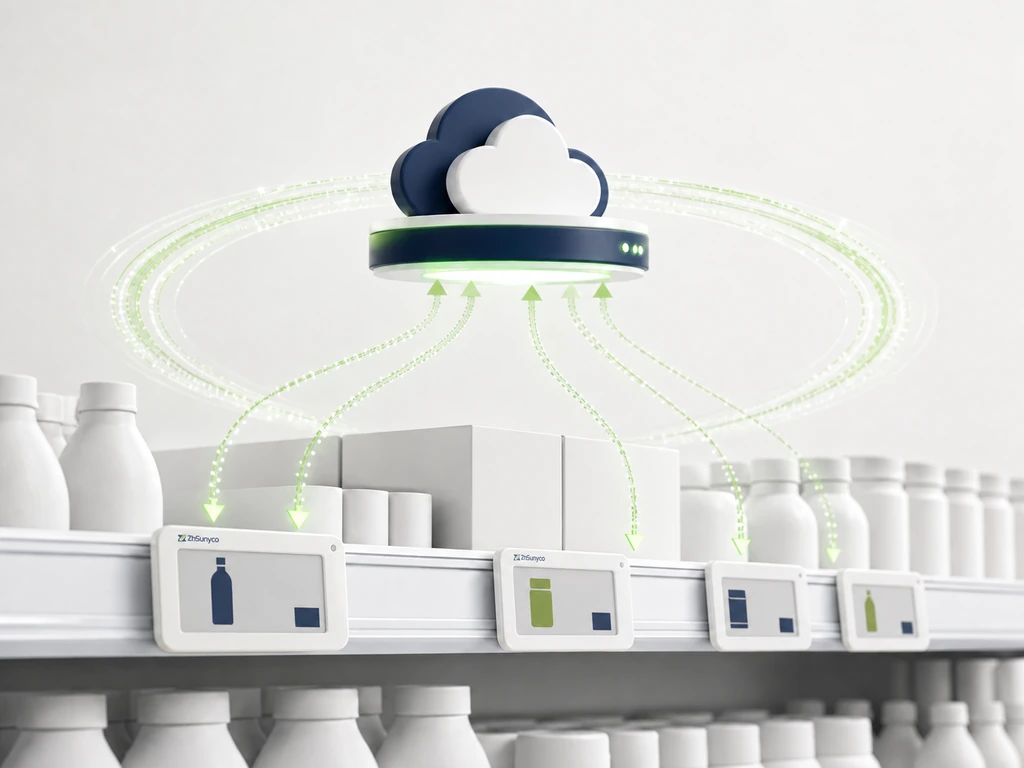
Three types of data flow from this infrastructure. Price execution data answers a simple question: did the 8 a.m. promotion push actually reach every label, and how long did it take? A system logging 9,987 successful updates out of 10,000 labels, with the 13 failures precisely located to Aisle 5 of Store #3, transforms what used to require a manual shelf audit. Promotional compliance data verifies that national campaigns are executing uniformly. For chains with dozens or hundreds of locations, this is not trivial. Operational health data covers battery levels, signal strength, and update success rates. It allows IT teams to maintain the network proactively rather than responding to failures after customers notice.
Different wireless protocols suit different store environments. 2.4 GHz systems use existing WiFi infrastructure for large-format stores needing broad coverage. 433 MHz Sub-GHz protocols offer superior wall penetration and reliable 13–15 meter ranges, making them well-suited for multi-room or densely shelved environments. Frequency-hopping spread spectrum (FHSS) technology ensures near-100% label update success rates by hopping across channels to avoid interference.
Centralized Control with Audit-Trail Precision
The data collection capability scales vertically when connected to a cloud management layer. A single dashboard lets a pricing team manage templates, schedule promotions, and roll out category-level price changes across every store simultaneously. These are operations that previously required printing and distributing paper tags over days.
The critical integration happens at the API level. ESL platforms that expose RESTful APIs (HTTP + JSON) can synchronize directly with existing POS, ERP, and pricing optimization systems. A price change decided in the analytics engine flows to the shelf without human re-keying. This closes what has always been the broken last mile of retail pricing: the gap between “we decided to change the price” and “the price actually changed on the shelf.”
Take a mid-size grocery chain running a seasonal promotion. Before: print 8,000 new tags, distribute to 15 stores, trust that staff applied them correctly, discover discrepancies during the next audit. After: configure the promotion template in the cloud platform, push to all stores, receive per-label confirmation within two minutes. The labor savings alone (15 to 30 percent fewer tag-change hours, conservatively) often justify the hardware investment before factoring in pricing optimization gains.
Core Pricing Analytics Techniques — Powered by Real-Time Shelf Data
Every pricing analytics technique becomes more powerful when it runs on live shelf data rather than stale reports. The methods are the same ones ecommerce operators use. The precision is what changes.
Price Optimization and Elasticity Modeling
Price elasticity measures how demand responds to price changes. A product with high elasticity loses significant sales volume from even small price increases. A product with low elasticity can sustain a price rise without meaningful volume loss. Identifying which products fall into which category is the foundation of profitable pricing.
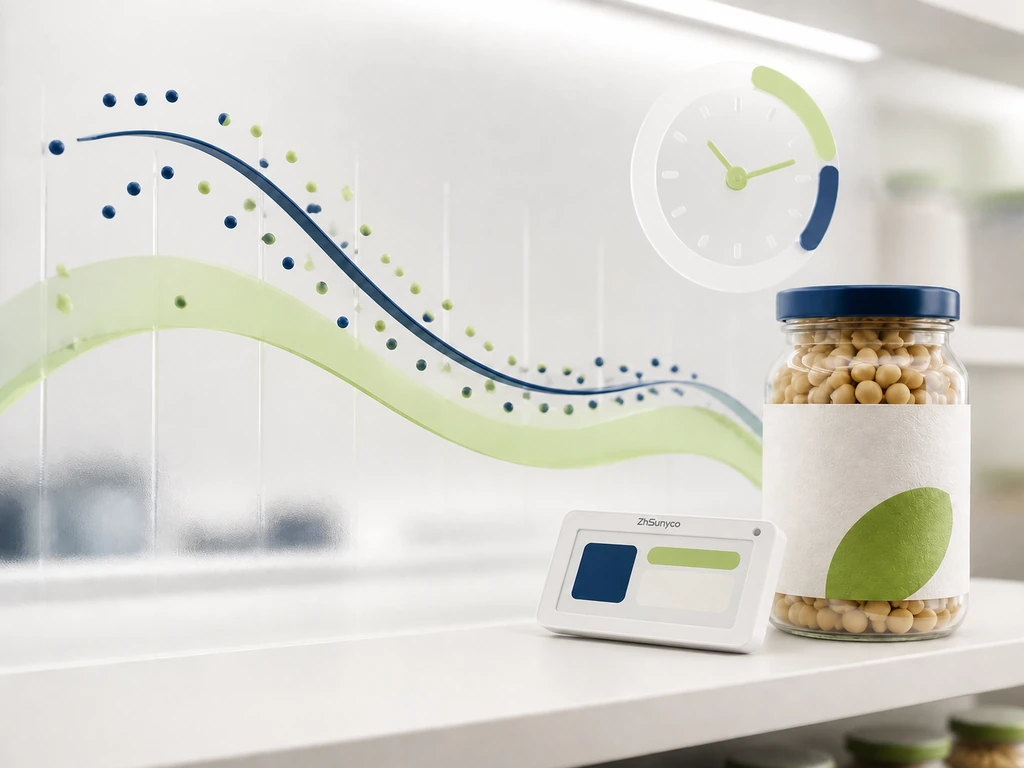
Traditional elasticity modeling in physical retail relied on quarterly sales reports. Useful for understanding what happened last season, nearly useless for deciding what to do next Tuesday. With real-time shelf execution data, elasticity models can update daily or even hourly. More importantly, modern causal machine learning techniques — specifically Double Machine Learning (Double ML) — can distinguish between correlation and causation in pricing outcomes.
That distinction matters. Suppose you lower a product’s price by 10% and sales rise 15%. Traditional regression says the price cut drove the lift. But what if a heatwave hit that week, a competitor was out of stock, and your own email campaign launched simultaneously? Double ML controls for these confounding variables, isolating how much of the 15% lift actually came from the price change versus external factors. The difference determines whether you replicate the strategy or recognize it as a one-off.
Dynamic Pricing: From Ecommerce Exclusive to Brick-and-Mortar Reality
Dynamic pricing — adjusting prices in real time based on demand, inventory, competitor moves, and contextual factors — has been Amazon’s competitive weapon for over a decade. The company changes millions of prices daily. Physical retailers, constrained by paper labels, were structurally locked out of this game.
ESL infrastructure changes the equation. When a retailer can update any shelf label in under two minutes, dynamic pricing becomes operationally feasible in physical stores. The most immediate applications are in perishable goods: a supermarket reducing bakery prices at 7 p.m. to clear same-day inventory, or a pharmacy adjusting prices on short-dated health products. Company Shop, a UK surplus supermarket chain, deployed ESL-driven real-time pricing across its estate and reported a 5% improvement in productivity alongside reduced waste. Prices on short-shelf-life goods now adjust automatically throughout the day based on remaining stock and time to expiry.
Dynamic pricing in physical retail requires transparency, and this boundary matters. Walmart’s recent large-scale ESL deployment sparked consumer backlash precisely because the conversation framed it as enabling “surge pricing”: the fear that prices would rise during peak shopping hours. The technology is not the problem. The communication is. Retailers deploying dynamic pricing must make clear that the goal is efficiency (reducing waste, matching demand) rather than exploitation. The stores that get this right will build trust. The ones that do not will generate Reddit threads.
Competitive Intelligence and Market Benchmarking
Internal data tells you how your prices perform. External data tells you where you stand. The final piece of the analytics stack is competitive intelligence: systematically monitoring competitor pricing and integrating those signals into your own decisions.
Price intelligence platforms now track hundreds of millions of SKUs across tens of thousands of retail locations globally. When a competitor drops a price on a key item, that signal can flow into your analytics engine within hours. The engine evaluates: should we match, undercut, hold, or differentiate by bundling? The decision deploys to the shelf via ESL. The system logs the outcome. The loop closes.
The operational KPI to watch is response time. Best-in-class retailers target two to four hours from competitor price detection to in-store label update, across all channels. Paper-based operations measure that interval in days or weeks.
The Business Case: What Hardware-Enabled Pricing Analytics Actually Delivers
Scattered across vendor white papers, case studies, and industry reports are consistent ROI figures. Consolidated, they tell a clear story.
| Benefit | Typical Impact | Context |
|---|---|---|
| Revenue lift | +3–7% | AI-driven pricing optimization across channels |
| Gross margin improvement | +2–5 percentage points | Price optimization combined with reduced unnecessary markdowns |
| Labor savings | 15–30% fewer hours on tag changes | ESL automation vs. manual paper label updates |
| Promotion effectiveness | Shift from ~2/3 ineffective to data-driven targeting | Real-time promotion performance feedback |
| Shelf price accuracy | Near 100% consistency between shelf and checkout | Centralized ESL management eliminates manual errors |
These gains multiply rather than simply add up. When ESL hardware provides a real-time data pipeline, the analytics engine operates on minute-level signals rather than week-old reports. When the analytics engine produces better recommendations, the ESL infrastructure executes them immediately rather than waiting for the next label-printing cycle. The result is a flywheel: better data leads to better decisions, which enable faster execution, which generates richer data.
The ESL hardware market reflects this convergence. Global ESL market size is projected to reach approximately $7.5 billion by 2033, growing at roughly 16–17% annually (industry composite from Maia Research, SkyQuest, Grand View Research), as major retail chains scale deployments to thousands of stores. For a typical supermarket deployment of around 10,000 labels, total investment — including hardware, software licensing, POS integration, and installation — typically ranges from $80,000 to $200,000. Against the combined labor savings, error reduction, and pricing optimization gains, payback periods of 12 to 18 months are common.
What makes this possible at the hardware level is the diversity of communication protocols available today. Multi-protocol ESL systems support 2.4 GHz for large-format stores, 433 MHz for dense or multi-room environments, NFC for close-range interactions, and BLE for mobile integration. This lets retailers deploy the right technology for each store format. Combined with cloud-based centralized management and open API/SDK integration, the infrastructure connects directly to existing POS and ERP systems. Price changes flow from decision to shelf without manual intervention. Providers like ZhSunyco have built their platforms around this multi-protocol architecture, offering retailers a single hardware partner across store formats rather than stitching together incompatible systems.
From Paper to Predictive: A Practical Implementation Starting Point
The gap between “we should do this” and “we are doing this” is where most pricing analytics initiatives stall. The following framework is not a vendor roadmap. It is a self-assessment tool to help you identify your actual starting point.
Assess your current state across three dimensions:
1. Data maturity: How do your sales and pricing records exist today? If the answer is “Excel files emailed on Monday,” your first priority is centralizing that data. Even a basic ERP integration creates a foundation. If you already have a data warehouse feeding dashboards, you can skip to hardware evaluation.
2. Price change frequency: How often do you adjust prices today? Quarterly batch updates suggest you are leaving significant margin on the table during the gaps. Weekly adjustments indicate readiness for faster cycles. Daily or intra-day changes mean you should already be on ESL infrastructure.
3. Store footprint and label technology: How many locations, and are they still on paper? A three-store chain can pilot ESL in one location for under $20,000 and measure results before scaling. A 100-store chain needs a phased rollout plan.
From that baseline, the path typically follows three phases:
Phase One: Start with what you have. Even with paper tags, begin tracking price-volume relationships at the SKU level. Move from “we think this price works” to “here is what last month’s data shows.” The analytical discipline matters more than the tool.
Phase Two: Deploy the data pipeline. Pilot ESL systems in one or two stores. The goal is not yet dynamic pricing. It is establishing the real-time data collection infrastructure and validating that shelf-level price execution data improves your analytics quality. Measure latency: how long from “analyst changes a price in the system” to “label updates on the shelf”? Target under five minutes.
Phase Three: Layer on intelligence. With real-time shelf data flowing, introduce AI-driven pricing recommendations. Start with a single category. Compare the model’s suggestions against human judgment. Track price realization rate — what percentage of recommended changes actually get implemented? — as the primary adoption metric. Expand when the data supports it.
The Shelf Edge Is Becoming the Smartest Place in the Store
The arc of retail pricing analytics bends toward autonomy. Three developments define where this is heading.
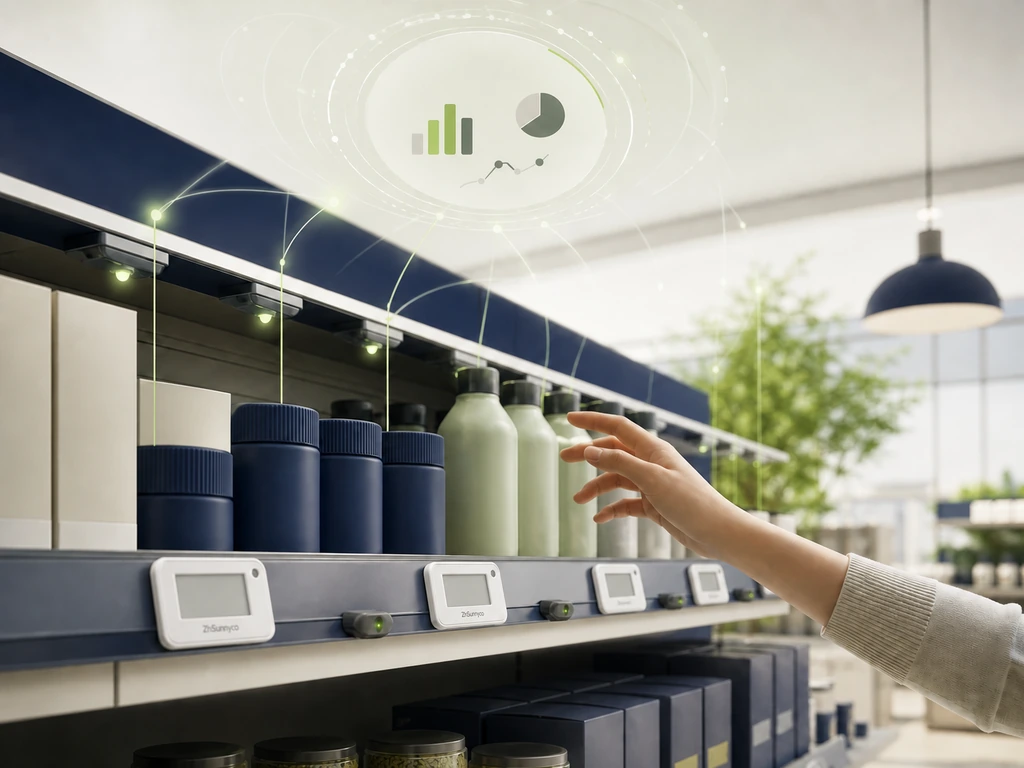
First, the shift from correlational to causal AI. Current pricing models excel at pattern recognition. They spot that when competitor X drops price, your sales of item Y decline. Next-generation causal inference frameworks ask a harder and more valuable question: if we change this price, what will happen, and why? These models, built on frameworks like DoWhy and CausalML, control for the mess of real-world confounders. Weather, promotions, supply shocks, competitor stockouts — all the factors that make naive correlations misleading.
Second, the emergence of emotional intelligence at the shelf. Researchers are experimenting with ESL-integrated systems that measure how long a shopper pauses in front of a product, whether they compare it with alternatives, and whether they ultimately buy. This data, combined with sentiment analysis from online reviews, builds a richer picture of price perception than transaction data alone can provide.
Third, the redefinition of the shelf edge itself. An ESL is already a display, a data collector, and an execution node. Add a low-power sensor and it becomes an inventory monitor. Connect it to a customer-facing app and it becomes a personalization surface. The shelf edge is evolving from a static price label to the most intelligent square inch in the store, and the foundation of every retailer’s pricing analytics strategy.
The retailers who understand this convergence — hardware, software, and analytics as one system, not three separate purchasing decisions — will be the ones who stop guessing and start knowing what their prices should be.
References
- Coherent Market Insights. “Artificial Intelligence in Retail Market — Share, Trends & Growth Forecasts.” 2026. https://www.coherentmarketinsights.com/industry-reports/ai-in-retail-market
- Shopify. “Retail Pricing Analytics: How to Refine Pricing Strategies with Data.” 2025. https://www.shopify.com/blog/retail-pricing-analytics
- Maia Research / SkyQuest / Grand View Research. “Global Electronic Shelf Labels (ESL) Industry Trends Analysis Report 2025, Forecast to 2033.” https://www.marketresearch.com/…
- FMCG Magazine. “Company Shop deploys electronic shelf labels to deliver dynamic real-time pricing.” https://fmcgmagazine.co.uk/company-shop-deploys-electronic-shelf-labels…
- Revionics. “Dynamic Pricing with Electronic Shelf Labels and Price Optimization.” https://revionics.com/blog/electronic-shelf-labels-price-optimization
- Competera. “Competitive Pricing Analysis: A Step-by-Step Guide for Retailers.” https://competera.ai/resources/articles/competitive-pricing-analysis
- Intelligence Node. “A Retail Guide to Predictive Pricing Analytics for Profit Maximization.” https://www.intelligencenode.com/blog/predictive-pricing-for-retail-professionals/
- ZhSunyco. “ESL Products — Multi-Protocol Electronic Shelf Labels.” https://www.zhsunyco.com/esl/
- ZhSunyco. “Case Studies — Retail ESL Deployments.” https://www.zhsunyco.com/case-studies/
- ZhSunyco. “Homepage.” https://www.zhsunyco.com/

 English
  Russian
  Spanish
  German
  Arabic
  French
  Bulgarian
  Polish
  Romanian
  Turkish
  Portuguese