


Inventory Management Problems: Why They Persist and How to Solve Them
Why Inventory Management Problems Are So Persistent
Inventory management sounds simple on paper: know what you have, know where it is, and reorder before it runs out. In practice, problems in inventory management multiply as businesses add SKUs, sales channels, and locations.
The root challenges of inventory management are structural. A mid-size retail operation with 5,000 SKUs, selling through both physical stores and online channels, faces a combinatorial explosion of data points. Every SKU-channel-location combination is a moving target. And most businesses are still aiming with spreadsheets and manual counts.
The numbers back this up. Research from the Auburn University RFID Lab and GS1 US found that retailers using manual or barcode-only tracking methods average just 63% inventory accuracy (GS1 US / Auburn RFID Lab, 2018). Nearly 4 out of every 10 inventory records are wrong. More wrong than right.
Why? Because most inventory systems are only as current as the last count. A retailer running weekly partial cycle counts on a 5,000-SKU catalog sees hundreds of SKUs drift out of sync between counts. A price change goes live online but the shelf tag hasn’t been swapped. A return is received but not re-entered. Each gap is small; together they erode the foundation every downstream decision rests on.
Inventory problems are not a one-time crisis that hits unlucky operators. They are the default state of any business that has not deliberately built the systems to prevent them.
The Most Common Inventory Management Problems Businesses Face
To make sense of the many ways inventory can go wrong, it helps to think in layers. Here is the diagnostic framework that the rest of this section unpacks.
The dangerous businesses are the ones where all three layers are compromised simultaneously, often without anyone realizing the connections. Here are the most common problems at each layer, and how to recognize them in your own operation.
Inaccurate Inventory Data and Tracking Gaps
This is where inventory problems begin. If your system says you have 50 units but the shelf holds 32, every decision downstream of that number is built on sand. Reordering, merchandising, promotion planning. All of it.
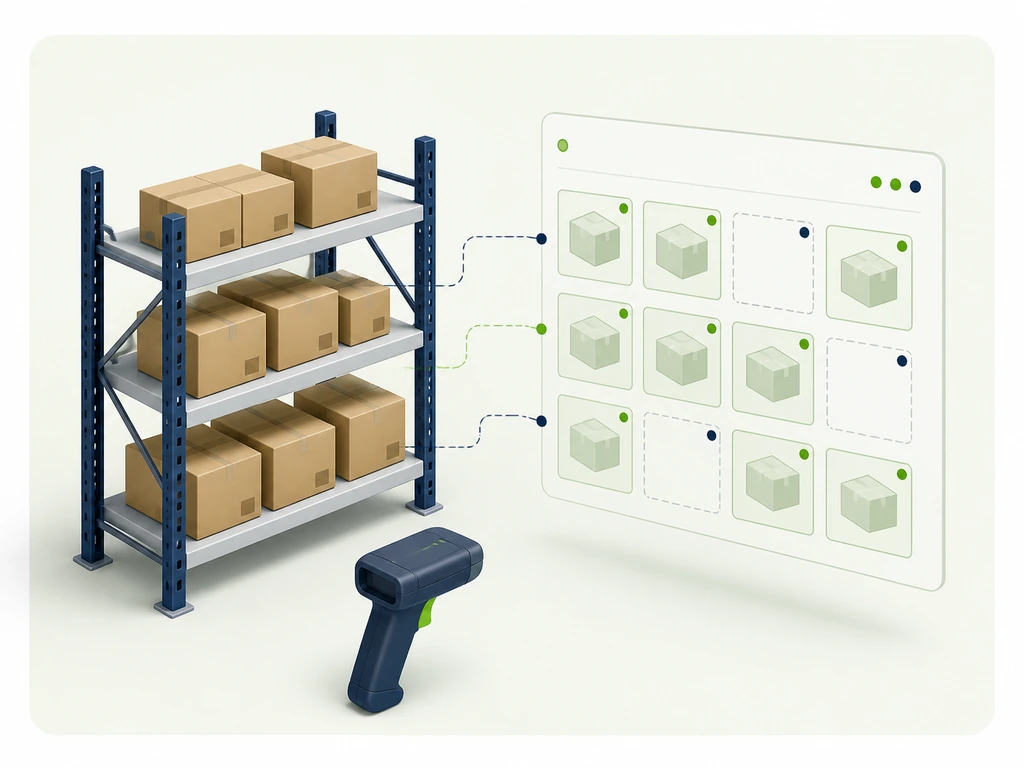
Manual data entry is the largest single source of error. Studies consistently show human data entry produces a 1–3% error rate per keystroke event. Across hundreds of daily transactions — receiving, transfers, adjustments, cycle counts — those errors compound.
Multi-channel selling amplifies the problem. An item sold online at 10:00 AM might not deduct from the in-store system until end-of-day batch sync. By then, a walk-in customer has already bought the same item off the shelf. The result: an oversell, a disappointed customer, and a refund. All caused by a data delay measured in hours.
Then there’s the shelf-to-system gap. The price tag on the shelf might show last week’s promotion price while the POS scans this week’s regular price. In retail, this isn’t just an inventory problem. It’s a customer trust problem, and potentially a compliance issue in jurisdictions with strict pricing laws.
According to industry benchmarks from the Association for Supply Chain Management (ASCM), Class A inventory (high-value, high-turnover items) should maintain at least 98% accuracy. Class C can accept closer to 95%. Businesses operating below these thresholds typically lose 4–6% of annual revenue to inventory-related inefficiencies (ASCM Supply Chain Operations Reference Model), directly attributable to inaccurate stock data.
Demand Forecasting Failures and Stock Level Imbalances
When your inventory data is unreliable, your forecasts become educated guesses. And when forecasts are wrong, the result is always the same: too much of what customers don’t want, and not enough of what they do.
The most common forecasting trap is anchoring to last year’s numbers. “We sold 200 units last October, so let’s order 220 this year.” But last year had a competitor’s stockout, an unseasonably warm month, and a TikTok trend no one predicted. History is a useful input; it is a terrible blueprint.
This is where the bullwhip effect kicks in. It’s a well-documented supply chain phenomenon where small fluctuations in consumer demand get amplified as they ripple upstream. A 5% dip in retail sales can translate to a 20% inventory overbuild at the distributor level and a 40% production cut at the manufacturer. The classic example comes from Procter & Gamble’s study of Pampers diaper orders: consumer demand was relatively stable, but wholesale orders swung wildly as each tier of the supply chain overcorrected.
Seasonal peaks and promotional events add another shock layer. A Black Friday promotion that clears triple the normal volume creates a data spike that throws off 12-month rolling averages. Without a forecasting model that can isolate and normalize these events, businesses end up either drowning in post-promo surplus or scrambling with costly rush orders when demand surprises on the upside.
The safety stock formula (Z × σ × √LT, where Z is the desired service level, σ is demand variability, and LT is lead time) provides a mathematical floor. But applying it requires accurate variability data, which circles back to the data accuracy problem: you can’t compute σ if your own inventory numbers are untrustworthy.
Sales Dip
Overbuild
Production Cut
Warehouse Inefficiency and Operational Bottlenecks
Even when the data is clean and the forecast is sound, poor warehouse inventory management and execution can undo both. Industry data from Tompkins International shows that picking accounts for 50–55% of total warehouse operating costs, and pickers spend 40–50% of their time simply walking between locations (Tompkins International, Warehouse Operations Benchmark Study).
Picture a typical warehouse day: an order comes in for 12 items across 8 different locations. Without slotting optimization — grouping frequently picked items together — the picker walks 3 kilometers to complete a single order. Multiply by 50 orders per shift, and one employee spends more time walking than picking.
The problem compounds when slotting is absent or outdated. The fastest-moving items might sit at the back of the warehouse because that’s where they were put six months ago, before sales patterns shifted. An SKU that was a C-mover last quarter and got buried on a top shelf is now an A-mover this quarter, but nobody updated its location.
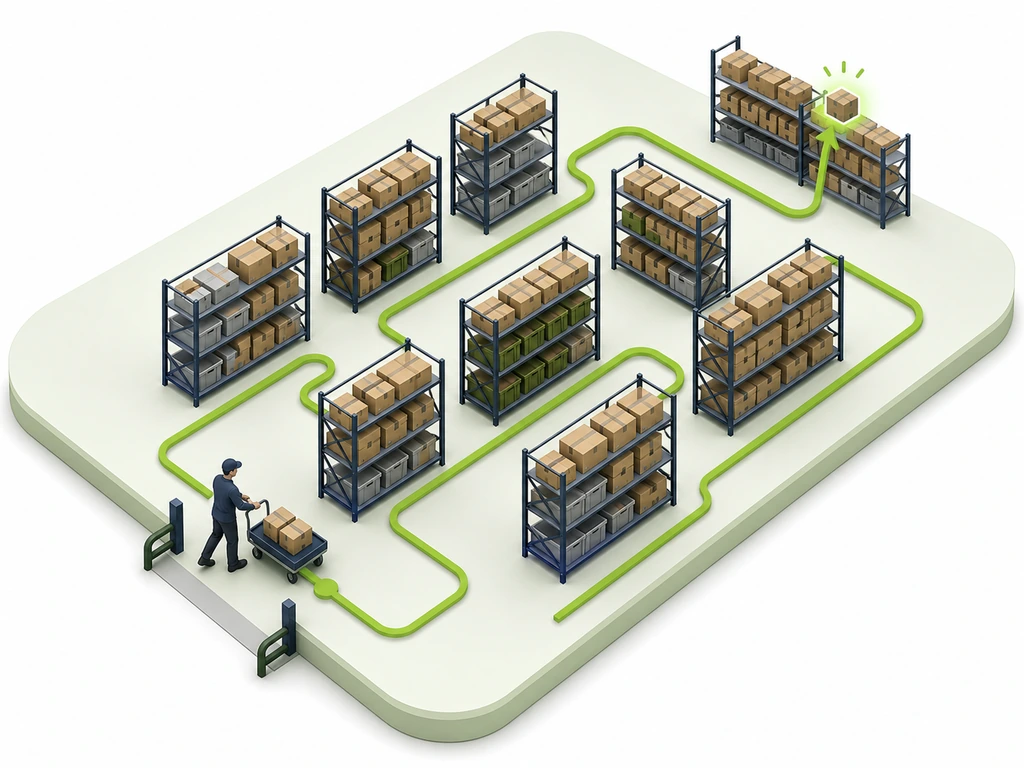
Then there’s the process friction. Receiving, putaway, picking, and counting are typically managed as four separate workflows. A pallet gets received on Monday, staged on Tuesday, put away on Wednesday, and someone comes to cycle-count it on Thursday. That’s three additional touches between arrival and the first count. Every touch is a labor cost and an error opportunity.
These inventory management issues — inaccurate data, flawed forecasts, and inefficient execution — rarely exist in isolation. A warehouse that can’t find its stock quickly feeds bad data into a forecasting system that then recommends the wrong reorder quantities, which means the warehouse receives stock it can’t properly slot. Breaking one link in the chain helps; breaking all three is transformative.
The Hidden Costs of Ignoring Inventory Management Problems
The price of poor inventory management is bigger than most operators calculate. Obvious costs like storage fees, spoilage, and rush shipping are only the surface layer. Beneath them are financial drains that compound silently and strategic wounds that never show up on a P&L but determine whether the business grows or stagnates.
Financial Losses: From Cash Flow Drain to Missed Revenue
The most measurable cost is inventory carrying cost: the total expense of holding stock over time. The standard formula covers capital cost (money tied up that could be earning returns elsewhere), storage, insurance, obsolescence, and administrative overhead. Industry benchmarks from the Institute for Supply Management place total carrying costs at 20–30% of inventory value per year (Institute for Supply Management). For a business holding $500,000 in average inventory, that’s $100,000–$150,000 in annual carrying costs before a single unit is sold.
On the other side of the coin is stockout cost. Harvard Business Review research has documented that the average retailer loses approximately 4% of annual sales to out-of-stock situations (Harvard Business Review, Retail Inventory Research). Unlike a carrying cost (which you can budget for), a stockout cost is invisible. It’s the customer who walks in, finds the shelf empty, and walks out. No transaction records the sale that didn’t happen.
Then come the clearance discounts. Excess inventory that doesn’t move eventually gets marked down. A product bought at $20 wholesale and sold at $12 clearance after six months of storage fees has a net margin far below zero. But the loss only becomes visible when you trace the full carrying-plus-liquidation cost chain.
And there’s the rush-order surcharge. When a stockout threatens a key customer relationship, businesses pay premium freight rates (sometimes 3–5× standard shipping) to close the gap. These are costs that well-managed inventory operations simply never incur.
Strategic Consequences: Customer Trust, Employee Morale, and Competitive Position
Some costs don’t appear on any ledger. PwC’s 2025 Customer Experience Survey found that 52% of consumers say they stopped buying from a brand after a single bad experience (PwC 2025 Customer Experience Survey). What counts as a bad experience in retail? Wrong price at checkout. Item showed as in-stock online but the shelf was empty. Promotion advertised but not honored because the system hadn’t updated.
Each of these is an inventory management failure dressed as a customer service failure.
The employee cost is equally real but rarely discussed. When staff spend their shifts manually reconciling counts, searching for misplaced stock, handling customer complaints about pricing errors, and firefighting instead of serving customers, the best employees leave. Warehouse and retail already face high turnover; unreliable systems accelerate it.
And while one business debates whether to fix its tracking, competitors are moving. The competitor across the street that deployed digital shelf labels and real-time inventory sync is delivering accurate prices and reliable stock availability on every visit. Shoppers notice. Not consciously, but in aggregate: “That store always has what I need at the price I expect.” This is the competitive cost of inaction, and it compounds with every quarter of delay.
Leading retailers are addressing these issues by treating shelf-level data capture as a foundational infrastructure investment. Electronic shelf label (ESL) systems turn every shelf edge into a live data node, updating prices and inventory records simultaneously across every location via cloud synchronization. When a price changes in the central system, every tag, in every store, refreshes automatically. The shelf and the system are always in agreement, which eliminates one of the most persistent data-layer problems entirely.
How Outdated Tracking Methods Amplify Every Inventory Problem
Here is an uncomfortable truth most inventory management advice skips: no software system, no matter how sophisticated, can fix data it never receives. If your shelf labels are paper and your counts are manual, your ERP system is operating on stale, incomplete, or outright wrong inputs.
The problem is chronological. A price change is decided in a Monday morning meeting. The ERP is updated by noon. But the paper tags on shelves? Those get swapped by Wednesday, if staffing allows. For two full business days, the system and the shelf disagree. Customers scan a barcode, see one price, and reach the register to find another. That two-day lag is not a software problem. It is a data-capture problem.
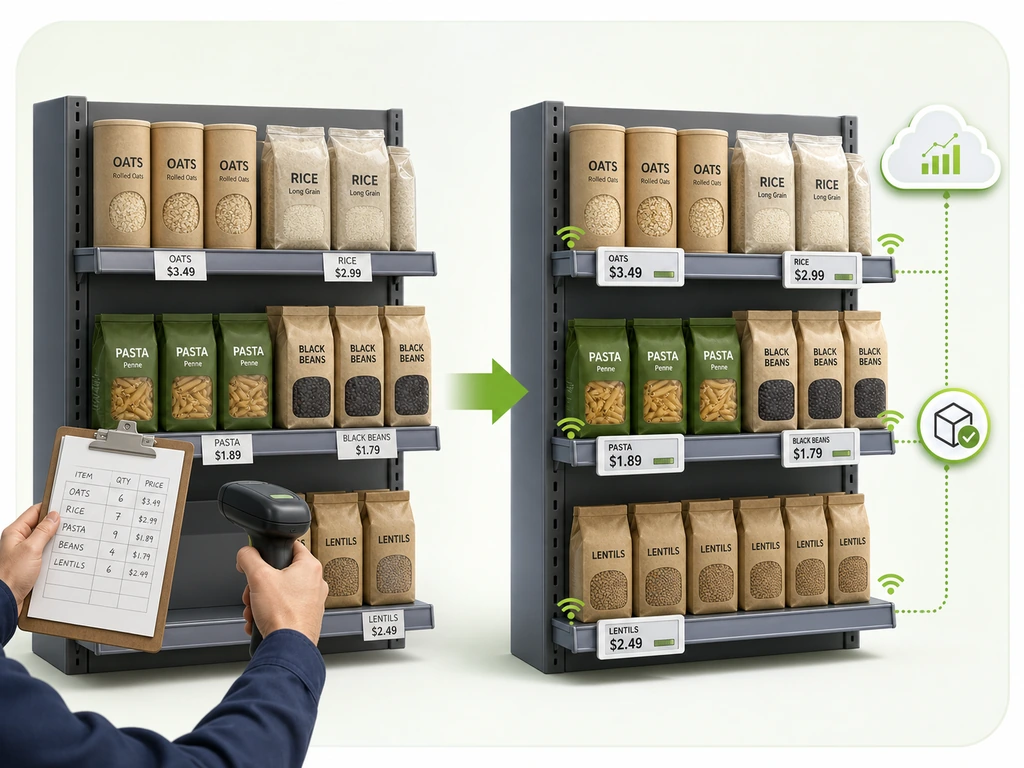
This is the garbage-in, garbage-out reality at the physical layer of retail. GS1, the global supply chain standards organization, has long emphasized that clean, real-time master data is the prerequisite for any supply chain visibility effort. Without it, planning, forecasting, and replenishment systems are all processing fiction.
The contrast with automated capture is stark. RFID-based tracking can count 1,000 items in approximately 30 seconds. The same task takes 2–4 hours of manual barcode scanning. Electronic shelf labels take this a step further: they don’t just display prices, they serve as persistent data endpoints that confirm stock presence, location, and current price in real time. The shelf becomes part of the inventory system, not a disconnected physical surface that lags behind it.
A comparison makes this concrete. Two grocery chains, identical footprint and SKU count. Chain A runs quarterly manual counts with paper tags updated monthly. Chain B uses RFID plus electronic shelf labels, refreshing inventory data every 15 minutes. Chain A enjoys about two weeks of accurate data after each quarterly count, then spends ten weeks flying blind: reordering based on stale numbers, marking down items that might actually be out of stock, and missing replenishment windows on fast movers.
This is not an argument about digital transformation in the abstract. It’s a recognition that inventory data is only as good as the slowest, most manual step in its collection chain. For most businesses, that step is still happening at the shelf edge. Until that changes, every other improvement is undercut before it starts.
Practical Solutions for Common Inventory Management Problems
Fixing inventory management isn’t about finding one perfect tool. It’s about identifying which link in your data-collection chain is weakest and reinforcing it with the right approach. The inventory management problems and solutions below are organized by root cause and by the layer of the operation they address.
Problem → Solution Mapping
| Inventory Problem | Root Cause | Solution Layer | Specific Action | Expected Impact |
|---|---|---|---|---|
| Inventory records don’t match physical stock | Manual counting, infrequent cycle counts | Data Capture Layer | Deploy RFID-enabled cycle counting or barcode system with daily spot-audits; integrate shelf-level electronic labels for real-time sync | Accuracy from ~63% to 95%+ |
| Frequent stockouts on high-demand items | Reorder triggers based on gut feel | Process Management Layer | Implement automated reorder points using lead-time demand plus safety stock buffers; track supplier reliability scores | Fill rate improvement to 98%+ |
| Excess slow-moving inventory tying up cash | No SKU velocity classification | Process Management Layer | Apply ABC classification with differentiated reorder policies; quarterly slow-mover review with liquidation triggers | Carrying cost reduction of 20–30% |
| Demand swings causing over- and under-ordering | Forecasting without seasonal decomposition | Decision Analytics Layer | Deploy demand forecasting that isolates seasonality, promotions, and trend components; use 80/20 rule on top-revenue SKUs | Stockout rate reduction of 30–50% |
| Picking and putaway taking too long | No slotting optimization | Data Capture + Process Layer | Re-slot based on velocity data; batch similar orders into wave picks; use mobile scanning to eliminate paper pick lists | Picking efficiency improvement of 40–60% |
| Shelf price doesn’t match system price | Paper tags updated weekly/monthly | Data Capture Layer | Electronic shelf labels with centralized cloud price management; one change propagates to all locations in seconds | Price accuracy to 100%; change propagation from days to minutes |
The pattern across every row is the same. The most impactful fix is rarely the most expensive one. It’s the fix that closes the gap between what your system thinks it knows and what’s actually happening on the shelf, in the warehouse, and at the point of sale. Start at the data layer. If your data isn’t trustworthy, everything built on top of it is a guess.
Zhsunyco is an electronic shelf label (ESL) manufacturer serving retailers, warehouses, and solution integrators. We design and manufacture ESL hardware and digital display solutions that can connect with existing retail and inventory platforms, helping businesses keep prices and product information synchronized at the shelf edge.

 English
  Russian
  Spanish
  German
  Arabic
  French
  Bulgarian
  Polish
  Romanian
  Turkish
  Portuguese