
The Checkout Counter Display Playbook: Technology, Integration, and ROI for Retailers
The checkout counter is the last 60 seconds of your customer’s in-store journey — and the most expensive real estate to waste. While most retailers have spent the last decade digitizing shelf edges and loyalty apps, the checkout zone has largely remained a static landscape of candy racks and faded “Thank You” signs. That is changing fast.
Global ESL (electronic shelf label) shipments hit record volumes in 2025. The driver: Walmart’s chain-wide rollout across 5,200 U.S. stores, with an estimated 400–500 million label units in deployment (invidis, 2026). The broader ESL market, valued at approximately $1.2 billion in 2024, is on track to reach $3.1 billion by 2030 — a 17.4% CAGR (Global Industry Analysts, 2025). But here is what the market numbers do not tell you: the checkout counter — not the shelf aisle — is where display technology delivers its highest return per square foot.
Research on point-of-purchase behavior bears this out. Digital displays at checkout lift impulse purchases by approximately 20% and make perceived wait times feel up to 35% shorter (Digital Signage Today, 2025). The psychology is simple: a customer standing at the register has already committed to spending money. Their wallet is open, their attention is captive, and a well-timed digital prompt — a promotion, a bundle offer, a loyalty sign-up QR code — converts at rates no shelf-edge tag can match.
So the question is not whether to digitize your checkout zone. It is which technology, how to integrate it, and how to measure the return. This playbook answers all three.
01.Comparing Display Technologies for the Checkout Zone
Before you talk to any supplier, get the technology straight in your own head first. Choosing a checkout display is not about picking the brightest screen — it is a three-way tradeoff between power and wiring cost, content richness, and deployment scale. Three technologies dominate the checkout counter today. Each sits at a different point on that spectrum.

| Technology | Power Model | Content Capability | Typical Cost per Unit | Best For |
|---|---|---|---|---|
| E-Paper (ESL) | Battery (5–10 yr) | Price & promo text, limited color | $5–30 | Mass deployment (1,000+ labels) |
| LCD / LED | Wired power required | Full video, touch, animation | $200–800 | High-engagement checkout zones (10–100 screens) |
| VFD / Segment | Wired power | Text & numbers only | $100–250 | Budget-sensitive small stores |
E-Paper Displays (ESL) — Ultra-Low Power, Mass Deployment Ready
If your checkout zone needs to display prices and promotions across dozens or hundreds of SKUs near the register, e-paper is the workhorse. The same bi-stable display technology that powers a Kindle — where an image holds without consuming electricity — now drives electronic shelf labels with 5- to 10-year battery life, support for four-color rendering (black, white, red, yellow), and communication across 2.4GHz, 433MHz, BLE, NFC, or Wi-Fi protocols.
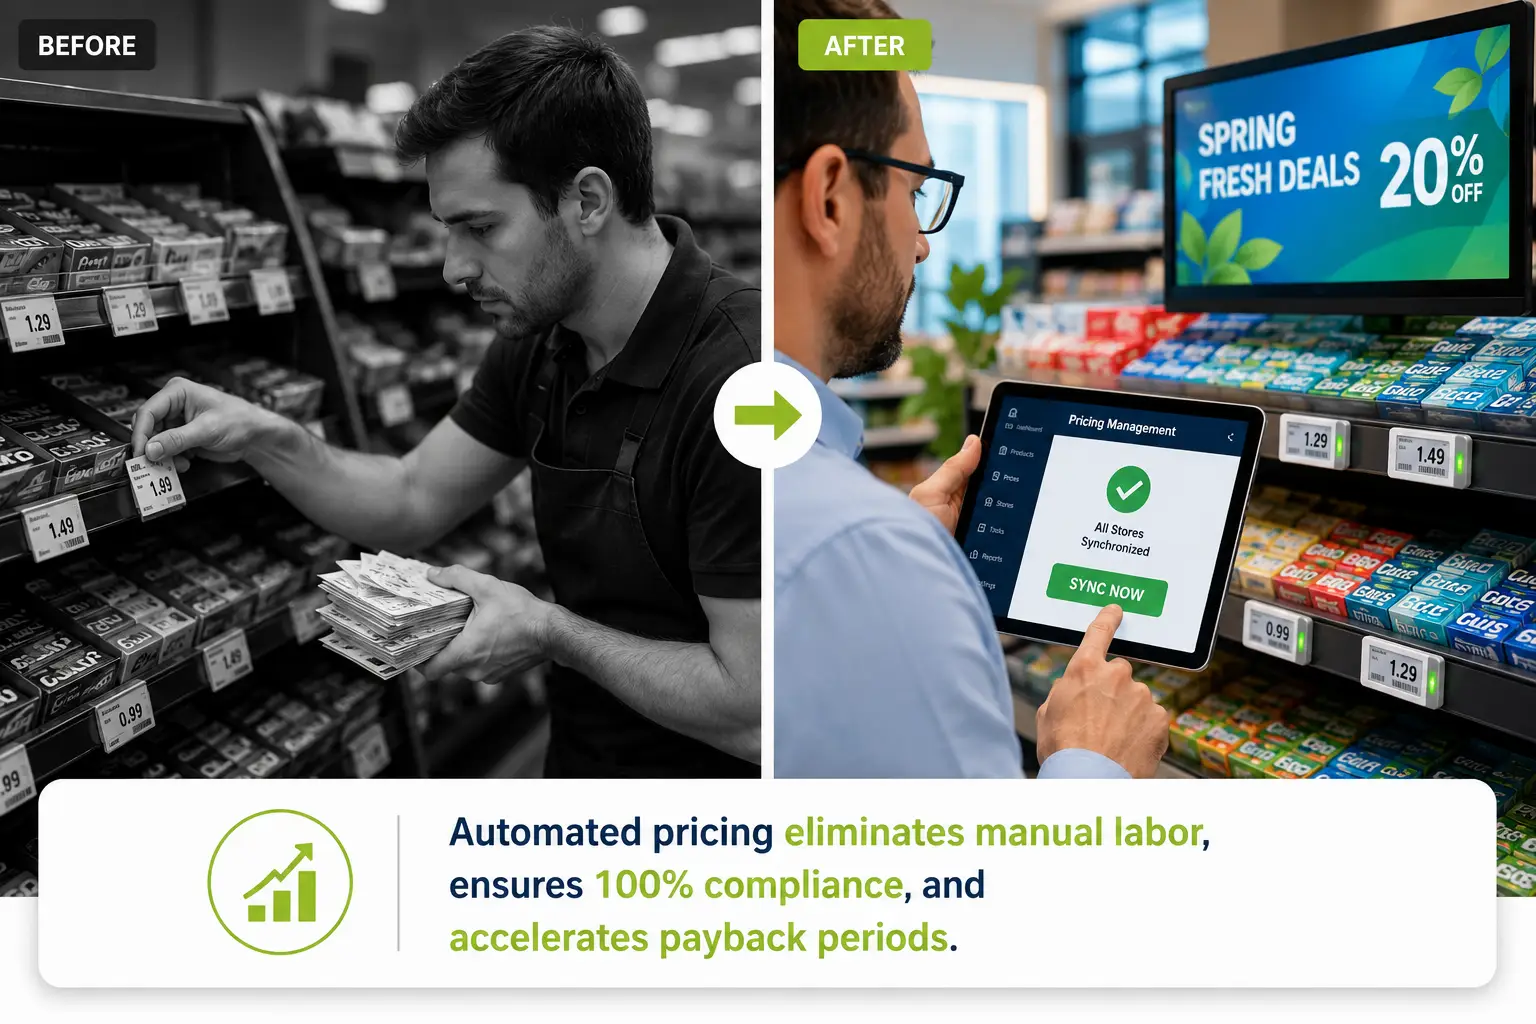
The key metric is scale economics. At $5 to $30 per unit and zero wiring cost, ESLs can be deployed across every checkout-adjacent shelf in a store for less than the cost of a single commercial LCD screen. When Walmart needed to bring digital pricing to 5,200 stores, it chose e-paper — and cut price-update time from two days to two minutes (invidis, 2026). For the checkout counter specifically, ESLs excel at real-time price sync: change a promotional price in the central system, and every checkout-zone label updates before the next customer reaches the register.
E-paper is not perfect. Refresh speeds of 1–3 seconds make it unsuitable for video or animation. Color palettes, while improving (E Ink’s Spectra 6 now delivers full color), remain more muted than LCD. In dimly lit stores, you will need front-light modules. But for the core checkout job — accurate, instantly updatable pricing and simple promotional messaging at scale — e-paper is the default choice for a reason.
LCD and LED Displays — Rich Media, High Engagement
When the checkout counter needs to do more than display a price — when it needs to sell — LCD takes over. A 15.6-inch Full HD capacitive touchscreen at the point of sale can rotate video promotions, prompt loyalty-program enrollment, display dynamic QR codes for mobile payment, and upsell bundled products triggered by cart contents. It is the difference between a price tag and a silent salesperson.
The tradeoff is infrastructure. LCDs need constant power and a data connection (Ethernet, Wi-Fi, or USB-C). Industrial-grade panels rated for 50,000-plus hours of 24/7 operation cost $400 to $800 per screen — 10 to 30 times more than an ESL. Brightness matters: indoor checkout zones need 300–500 nits; positions near store windows should target 500–700 nits to stay readable. Touch technology also requires a deliberate choice. Capacitive (PCAP) gives a smartphone-like experience but may not work with gloved hands. Resistive handles gloves but feels less responsive.
The real ROI of an LCD at checkout is not in price display. It is in the idle moments between transactions, when the screen becomes a digital billboard for your highest-margin products. McDonald’s reported a 22% sales lift from upselling prompts on self-service kiosk screens. A customer-facing POS display turning idle seconds into incremental basket dollars follows the same logic.
VFD and Segment Displays — When Simplicity Wins
Not every checkout counter needs a high-definition screen. For a small convenience store, a neighbourhood pharmacy, or a budget-conscious independent retailer, a vacuum fluorescent display (VFD) showing the transaction total and a “Thank You” message may be all that is needed. These units cost $100–250, have essentially zero failure rate over a decade of use, and remain readable even in bright overhead lighting.
The limitation is obvious: text and numbers only — no graphics, no video, no remote content updates. VFD is a shrinking category as LCD prices fall, but it still has a place where the checkout job is purely transactional and the budget is genuinely tight.
02.How Checkout Displays Connect to Your POS and Store Systems
A checkout display is not a standalone device. It is the visible endpoint of a data chain that starts in your POS, passes through inventory and pricing systems, and lands on a screen the customer sees. Understanding that chain is what separates a deployment that runs smoothly from one that becomes an IT headache. This section answers the question most buying guides skip: how does this actually connect?
| Architecture | Data Path | Speed | Remote Management | Best Fit |
|---|---|---|---|---|
| Local LAN | POS → local server → base station → displays | <50ms latency | Limited (on-site only) | Single store or small cluster |
| Cloud | POS → cloud platform → internet → base station → displays | Variable (depends on connection) | Full (anywhere with internet) | Multi-store chains needing centralized control |
| Hybrid | POS → local base station + cloud management dashboard | <50ms for updates, cloud for oversight | Full remote oversight + local speed | Mid-to-large chains (most common in practice) |
Integration Architectures — Local Server vs Cloud vs Hybrid

There are three ways to connect checkout displays to the systems that feed them data, and the right choice depends almost entirely on your store count and IT resources.
A local LAN architecture keeps everything on-premise. The ESL management server sits on the store’s internal network, communicates with wireless base stations, and pushes updates to displays. Data never leaves the building, latency stays under 50 milliseconds, and the system works even if the internet goes down. This is the right choice for a single store or a small cluster where centralized oversight is not needed.
A cloud architecture moves the management layer offsite. Pricing data flows from your POS or ERP through a cloud platform, which routes it to base stations in each store over the internet. The benefit is centralized control: one dashboard manages pricing and promotions across every location simultaneously. UK grocery chain Asda used this model to deploy 700,000 ESLs across more than 250 Express convenience stores (Retail Technology Innovation Hub, 2025). The tradeoff is dependence on internet connectivity — if the store’s connection drops, remote updates stop.
In practice, most mid-to-large chains land on a hybrid model: local base stations handle real-time price pushes with sub-50ms latency, while a cloud dashboard provides remote oversight, multi-store reporting, and the ability to push chain-wide promotions from headquarters. The software stack is increasingly cross-platform — modern ESL management systems often run on .NET 6.0 with support for Windows, Linux, macOS, and Docker deployment — so your IT team is not locked into a specific server environment.
Communication Protocols — What Makes Price Updates Reach the Screen
Once the architecture is chosen, the next question is how the data physically travels the last 50 meters — from the base station to the display sitting on the checkout counter.
| Protocol | Range | Penetration | Power Draw | Bidirectional | Typical Use |
|---|---|---|---|---|---|
| 2.4GHz | ~30m indoor | Moderate (walls reduce range) | Low | Yes (most implementations) | Bulk price updates in open-plan supermarkets |
| 433MHz | ~50m+ | Strong (penetrates multiple walls/floors) | Low | Yes | Multi-level stores, warehouses, buildings with thick walls |
| BLE 5.0 | ~10–50m (depends on mode) | Moderate | Very low | Yes | Interactive labels, smartphone pairing, proximity triggers |
| Wi-Fi | ~50m+ (via AP) | Moderate | High | Yes | LCD screens pushing video/image content |
| NFC | <10cm (near-field) | N/A (contact required) | Zero (passive) | Limited | Consumer phone interaction (tap for product info, traceability QR) |
The protocol choice is not academic — it directly affects how many base stations you need, whether signals penetrate your store’s walls and shelves, and how quickly thousands of labels can update simultaneously.
For most supermarket checkout zones, 2.4GHz is the default. It offers a practical balance of range (~30 meters indoors), update speed, and bidirectional communication — the display can confirm it received the update. For stores spread across multiple floors or buildings with thick concrete walls, 433MHz provides stronger penetration with comparable power draw.
Underpinning many modern ESL deployments is MQTT (Message Queuing Telemetry Transport), a lightweight publish-subscribe messaging protocol originally designed for IoT sensor networks. In a retail context, MQTT allows the management system to publish a single price-change message to a topic (e.g., “store-14/checkout-zone/promotions”), and every display subscribed to that topic updates simultaneously. It is the digital equivalent of a store-wide PA announcement — one message, every relevant device hears it, zero individual phone calls. For system integrators evaluating suppliers, open MQTT support on base stations is a strong signal that the hardware will play nicely with existing IoT infrastructure rather than demanding a proprietary walled garden.
03.The Business Case — ROI, Cost Savings, and Operational Impact
Technology decisions at the board level are rarely won on specs alone. They are won on a spreadsheet. Here is the one you need.
| Dimension | Traditional (Paper / Static) | Digital (ESL + LCD) | Impact |
|---|---|---|---|
| Price update time | 1–2 days (manual replacement) | Under 2 minutes (batch push) | ~1,440× faster |
| Labor cost per store | ~$15,000–25,000/year (staff hours on tag swaps) | Near zero (automated) | Full annual saving |
| Pricing error rate | 2–3% (manual mistakes) | Under 0.01% (auto-sync) | Fewer customer complaints and compensation claims |
| Promotion compliance | ~60% (missed or misapplied labels) | Over 99% (automated enforcement) | Higher promotional revenue captured |
| Impulse purchase uplift | Baseline | +15–20% | 15–20% incremental basket revenue |
| Paper / printing cost | Recurring annual expense | Zero (e-paper static display = zero power) | Ongoing saving |
| Typical payback period | N/A | 9–14 months (chain-wide) | Faster at scale |
Two numbers matter most to procurement teams. First: Walmart cut its price-update cycle from two days to two minutes. Second: industry data from E Ink shows the typical payback period for ESL deployments has dropped from roughly 36 months to 9–14 months, as hardware costs fell and deployment scale grew (Chain Store Age, 2025).
But the operational savings — labor and paper — tell only half the story. The revenue side matters more. A checkout zone with digital displays captures roughly 15–20% more impulse purchases than a static equivalent. In a supermarket doing $10 million in annual revenue, a 3% overall basket uplift from checkout-zone digitization means $300,000 in incremental revenue — before you count a dollar of labor savings. For chains with 50 or more locations, the compounding effect typically drives the payback period below 12 months.
One nuance worth surfacing: the ROI case gets stronger as you add more stores. A single-store pilot bears the full cost of software setup, integration engineering, and staff training. Store two through store fifty bear almost none of those fixed costs — they inherit the configured platform, the trained processes, and the proven content templates. This is why the chains moving fastest on checkout digitization (Walmart, Asda, Carrefour) are also the largest.
04.How to Choose the Right Checkout Display Solution for Your Stores
By this point, you understand the technologies, the integration architecture, and the business case. The final step is turning that knowledge into a supplier selection process that surfaces genuine capability rather than polished sales decks.
Three Questions to Answer Before You Talk to Any Vendor
1. What is your deployment scale? A single store with 2 checkout lanes has fundamentally different needs from a 200-store chain. The former can run a local-LAN ESL setup with a single base station. The latter needs a cloud or hybrid platform with centralized price management, multi-store reporting, and role-based access control.
2. What content do you need to display? If the answer is “prices and simple promotional text only,” e-paper ESLs are the right technology and the per-unit cost will be $5–30. If the answer includes “video promotions, dynamic QR codes, loyalty sign-up forms,” you are in LCD territory at $200–800 per screen. Many chains deploy both — ESLs for shelf-edge and checkout-adjacent pricing, a smaller number of LCDs for high-traffic checkout lanes.
3. What does your IT infrastructure look like today? If you already run a modern POS system with API access, integration is typically a matter of connecting the ESL management software and configuring the data-mapping rules. If your POS is legacy or proprietary, factor integration engineering time into the project timeline.
Supplier Evaluation Checklist
Once you have clear answers, use this checklist to evaluate suppliers. Every item maps to a real capability that affects deployment success — there are no filler questions here.
- Multi-technology portfolio: Can the supplier provide both ESL and LCD solutions, or will you need to manage two vendors? A single-vendor portfolio simplifies integration, support, and ongoing maintenance.
- Protocol coverage: Does the hardware support at least 2.4GHz and BLE? Is MQTT available on the base stations for IoT integration? The wider the protocol support, the more deployment scenarios the system can handle without hardware swaps.
- Software openness: Are SDKs and APIs available for your IT team or system integrator? Can the software run on your existing server environment (Windows, Linux, Docker)?
- Production capacity and lead times: What is the manufacturer’s annual output? Can they deliver samples within 7 days and mass production within 15 days? Capacity constraints are the single most common reason deployment timelines slip.
- Quality certifications and defect rate: Look for ISO 9001 (quality management), CE (EU compliance), and RoHS (hazardous substance restriction). A manufacturer that also holds TF16949 — an automotive-grade quality standard far stricter than typical consumer-electronics certification — is running a quality system well above the industry average. Ask for documented defect-rate data. A benchmark below 0.01% signals mature process control. Manufacturers with vertically integrated production — PCB design, SMT assembly, and final QC all under one roof — tend to deliver the most consistent results because nothing gets outsourced across contractors with mismatched standards.
- Customization depth: Can the supplier customize screen sizes, housing colors, logo placement, communication protocols, software UI, and packaging to your requirements? For checkout counters specifically, you may need non-standard display dimensions to fit existing counter widths, or custom mounting hardware (rail, hook, or stand-mount) that matches your store fixtures.
- After-sales support and warranty: What is the hardware warranty period? Is software upgraded for free? Is there a remote technical support team, and what is the typical response time? For international buyers, ask whether the supplier has regional warehouse stock — a European or North American warehouse can cut replacement-part delivery from weeks to days.
- Global logistics capability: If you are sourcing from an overseas manufacturer, confirm they work with established international carriers (DHL, UPS, FedEx) and can optimize container loading to minimize freight cost per unit.
These checklist items are drawn from the operational reality of retailers who have already been through ESL and digital display deployments — some smoothly, some not. A supplier who scores well across all eight dimensions is not necessarily the cheapest on a per-unit basis. They are almost certainly the cheapest over a five-year total cost of ownership.
If you are building your shortlist and want to benchmark another supplier’s range and technical specifications, Zhsunyco’s product catalog is available at www.zhsunyco.com.
References
- invidis. “Walmart Gears Up for Chain-Wide ESL Roll-Out.” March 2026. https://invidis.com/sixteen-nine/2026/03/09/walmart-gears-up-for-chain-wide-dsl-roll-out/
- Global Industry Analysts. “Electronic Shelf Labels (ESLs) — Global Strategic Business Report.” 2025. https://www.giiresearch.com/report/go1883887-electronic-shelf-labels-esls.html
- Digital Signage Today. “Point-of-Purchase (POP) Display: How They Work & Their Retail Impact.” 2025. https://www.digitalsignagetoday.com/blogs/point-of-purchase-pop-display-how-they-work-their-retail-impact/
- Chain Store Age. “The Rise of Electronic Shelf Labels in Retail.” 2025. https://chainstoreage.com/rise-electronic-shelf-labels-retail
- Retail Technology Innovation Hub. “Grocery Giant Asda Goes Big on ESLs.” October 2025. https://retailtechinnovationhub.com/home/2025/10/8/grocery-giant-asda-goes-big-on-esls-our-biggest-retail-technology-articles-on-linkedin-right-now
- EuroShop. “ESL Display Technologies Compared: Which Solution Fits Which Retail Use Case?” 2026. https://www.euroshop-tradefair.com/en/media-news/euroshopmag/retail-technology/esl-display-technologies-compared-which-solution-fits-which-retail-use-case
- Zhsunyco. Corporate Profile. https://www.zhsunyco.com/corporate-profile/
- Zhsunyco. Customized Service. https://www.zhsunyco.com/customized-service/
- Zhsunyco. Digital Price Tag. https://www.zhsunyco.com/digital-price-tag/
- Zhsunyco. Homepage. https://www.zhsunyco.com/
