
Sustainable Retail Display Solutions — A Comprehensive Guide to Greener Stores and Smarter Operations
What Are Sustainable Retail Display Solutions?
Sustainable retail display solutions encompass every customer-facing visual element in a store — shelf labels, promotional signage, end-cap displays, window graphics, and fixture systems — reimagined through the lens of environmental and operational efficiency. Rather than a single product category, this is an integrated approach that spans two domains: physical displays (the materials and structures that hold and present merchandise) and digital displays (the screens, tags, and signage that communicate pricing and promotions).
The common thread is simple: eliminate waste without sacrificing commercial impact. A traditional supermarket chain with 200 locations, each replacing 500 paper promotional cards per month, burns through 1.2 million sheets of paper and thousands of labor hours annually — all for content that becomes obsolete within weeks. Sustainable alternatives break this cycle at its root. They replace disposable materials with reusable hardware and replace consumable paper with updateable digital surfaces.
The solutions available today fall into four broad categories, each addressing a different slice of the retail display footprint: e-paper digital signage and electronic shelf labels (ESL), reusable and modular fixture systems, recycled and bio-based display materials, and digital-physical hybrid approaches. The following sections unpack each category, then provide the cost framework and selection roadmap to help you determine which combination fits your retail operation.
Why Sustainable Retail Displays Matter Now
For years, sustainability in retail displays was treated as a brand virtue — nice to have, optional, a differentiator for premium positioning. That era is over. Four converging forces have turned sustainable displays from a “someday” initiative into an operational and competitive imperative.
| Driver | What’s Happening | What It Means for Retailers |
|---|---|---|
| Regulatory pressure | The EU Packaging and Packaging Waste Regulation (PPWR, Regulation (EU) 2025/40) entered into force on February 11, 2025, and becomes legally binding across all Member States from August 12, 2026. It mandates recyclability thresholds (Grade C by 2030), packaging minimization, and reusable packaging targets — with single-use plastic group packaging and certain single-use formats banned from January 1, 2030 | Non-compliance means market access loss and financial penalties across the entire EU |
| Cost economics | U.S. electricity prices are rising at their fastest rate in a decade, driven by data-center expansion. Retail labor costs continue climbing, with manual price-tag changes consuming 50+ hours per week in a typical mid-size grocery store | Low-energy digital displays and automation deliver hard operational savings that compound annually |
| Consumer expectations | Multiple 2024–2025 surveys confirm that Generation Z and Millennial shoppers — now the largest consumer demographic — show a strong and growing preference for brands with visible sustainability commitments, influencing both store choice and purchase decisions | Sustainability is no longer a differentiator; it is table stakes for foot traffic and brand relevance |
| Competitive dynamics | NRF 2026 framed the trend as “sustainability through the backdoor” — retailers are adopting sustainable display practices not because they are altruistic, but because lower energy costs, lighter logistics, and regulatory compliance make them the economically rational choice. Competitors who move first capture both cost advantages and brand equity | Lagging behind means competing at a structural cost disadvantage |
The PPWR timeline deserves particular attention because it creates a hard compliance window, not a suggestion. The regulation’s Extended Producer Responsibility (EPR) mechanism ties fees directly to packaging and display material choices — reusable systems are often exempt from the heaviest fees, creating an immediate financial incentive to switch. For retailers operating in or exporting to the EU, the clock started ticking on February 11, 2025. The binding deadline of August 12, 2026, is closer than most procurement cycles.
Types of Sustainable Retail Display Solutions
Before examining each category, it helps to have an evaluation framework. When assessing any sustainable display solution, three dimensions matter most: its energy model (does it consume power continuously, only during updates, or not at all?), its lifecycle (single-use, reusable, or fully recyclable?), and its best-fit retail scenario (shelf edge, end cap, window, or store-wide deployment).
E-Paper Digital Signage and Electronic Shelf Labels (ESL)
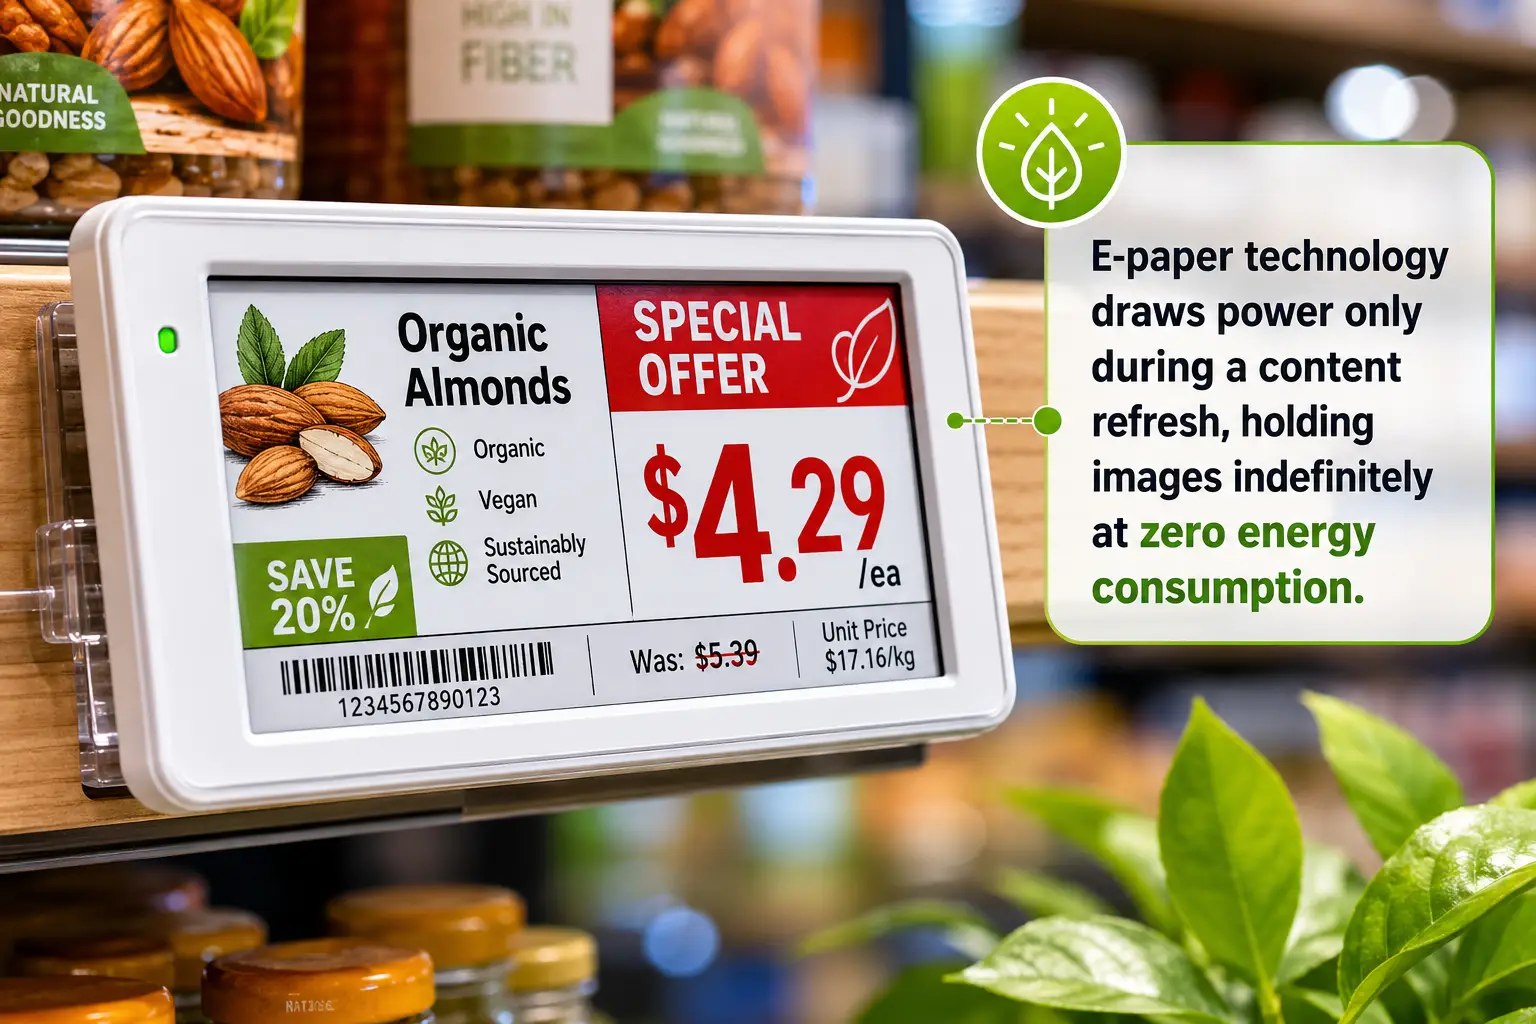
E-paper technology — built on E Ink’s bi-stable display principle — is the most significant shift in retail display sustainability in a decade. The defining characteristic of bi-stable e-paper: it draws power only during a content refresh. Once an image or price is displayed, the screen holds it indefinitely at zero energy consumption.
Compact electronic shelf labels (2–4 inches) replace paper price tags at the shelf edge. Mid-size e-paper posters (13–32 inches) handle promotional displays and category signage. Large-format e-paper screens (up to 75 inches) serve window advertising and information boards. A single store can deploy over 4,000 ESL tags managed from one cloud platform, with price and promotion updates pushed to all locations simultaneously.
Wireless protocol support — spanning 2.4GHz, 433MHz, BLE, NFC, and WiFi — means these systems integrate with existing POS and IoT infrastructure through open protocols like MQTT, avoiding vendor lock-in. ESL tags are rated for 5–10 years of service life, during which they eliminate 100% of the paper, printing, and manual labor associated with traditional price labels.
For retailers evaluating ESL vendors, the key differentiators are protocol flexibility, software openness (API and SDK availability for custom integrations), and manufacturing scale — factors that directly affect deployment speed and long-term reliability. Companies like Zhsunyco®, a top-tier Chinese ESL manufacturer, illustrate what mature production capability looks like: 12 SMT production lines in a 20,000m² facility, support for all five major wireless protocols, MQTT-based open base stations for seamless POS and IoT integration, a cloud management platform with 100% customizable UI, and certifications including CE, ISO 9001, RoHS, and TF16949. With mass production lead times as short as 7 days and a one-year hardware warranty backed by lifetime free software upgrades, the operational risk of ESL adoption has fallen substantially. (Zhsunyco ESL platform) (Quality management system)
Reusable and Modular Fixture Systems
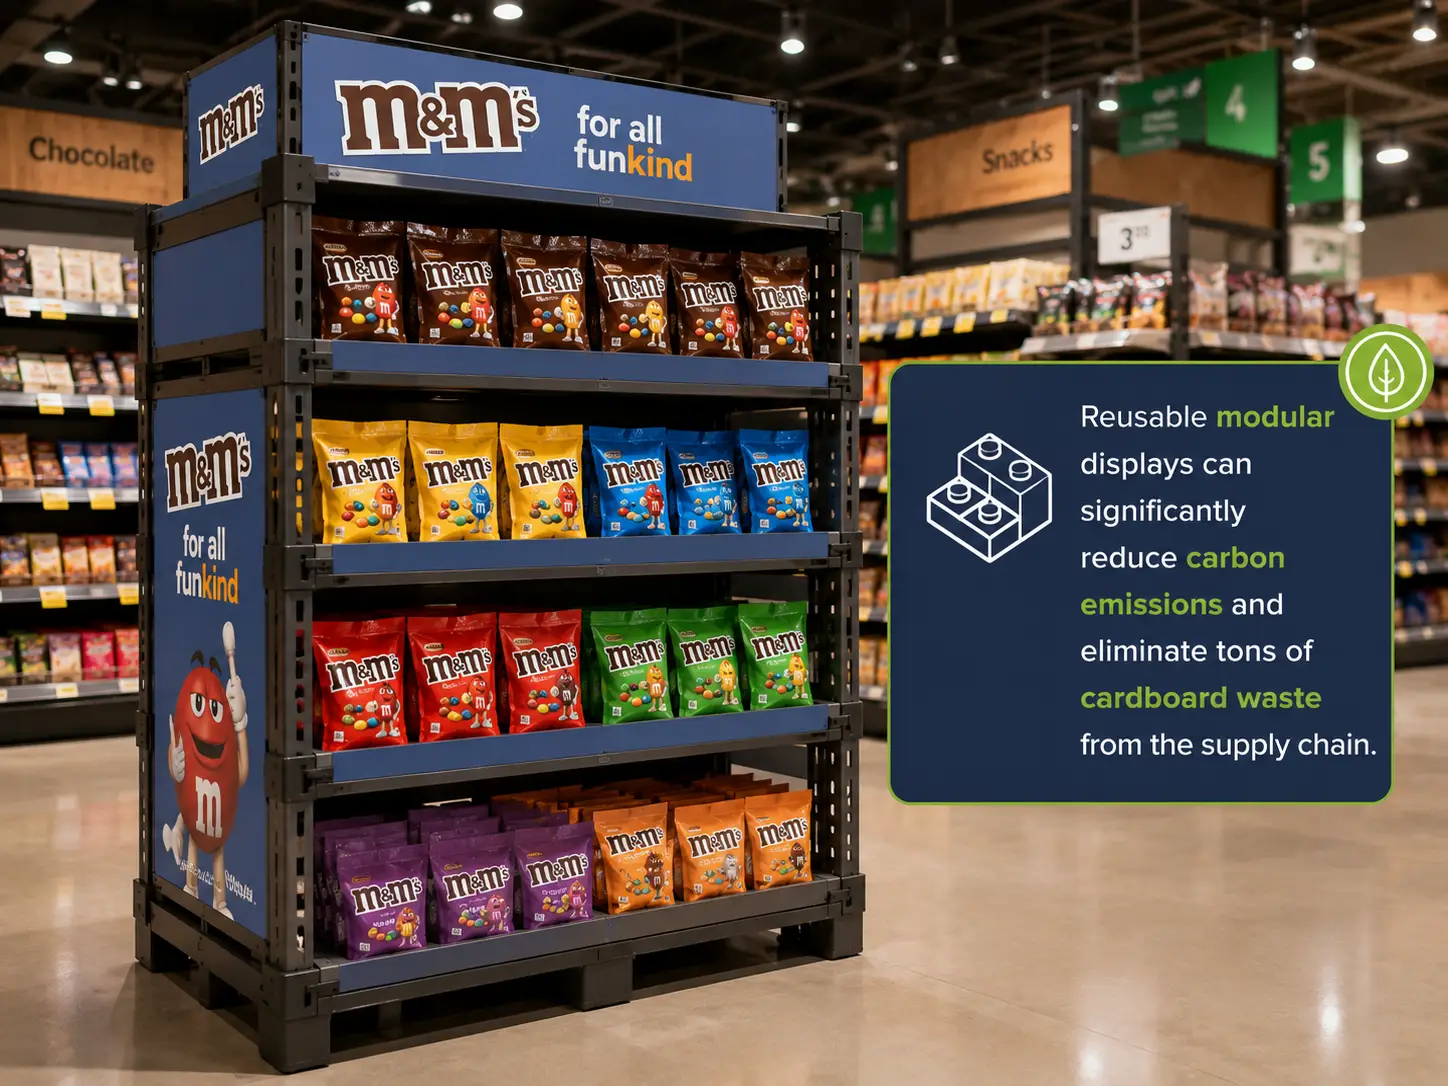
While e-paper addresses the digital display layer, reusable fixture systems tackle the physical structures that hold and present merchandise — the end caps, display tables, promotional stands, and shelf-ready packaging that dominate in-store visual real estate.
The core concept is straightforward: design once, reuse across multiple campaigns, reconfigure rather than replace. Three operational models have proven themselves at scale. Modular aluminum frame systems use tool-free assembly and interchangeable graphic panels, allowing L-shaped, U-shaped, and T-shaped configurations to be rebuilt from the same component set. Pooling models — exemplified by Tosca’s reusable crate and tray service — operate on a pay-per-use basis, with the provider handling cleaning, logistics, and replenishment. Flat-folded metal display systems like Origami™ ship and store compactly, then unfold by hand in-store. Exchangeable polypropylene graphic foils enable re-branding between campaigns without replacing the structural frame.
The commercial case is compelling. The Mars Wrigley and Coles collaboration in Australia provides one of the best-documented examples: stackable, shelf-ready modular displays delivered a 14% sales uplift. Reusable display units repurposed 8 tons of plastic and eliminated 72 tons of cardboard waste from the supply chain. Carbon emissions dropped 34%, and the program scaled to 700 stores nationwide (Economics of Mutuality Alliance). Across the category, lifecycle CO₂ savings for reusable systems range from 60–80% compared to single-use cardboard equivalents. After amortization across 3–6 campaigns, per-use costs fall 30–45% below single-use alternatives.
Recycled and Bio-Based Display Materials
For retailers who cannot replace their entire display infrastructure at once, material selection offers the lowest-friction entry point to sustainable display. The past two years have seen a wave of professional-grade alternatives reach commercial maturity.
Three material categories now compete directly with conventional PVC and virgin plastics. Recycled-content substrates, such as PolyAL — a display board with a 100% post-consumer recycled core developed by Barrows Global in South Africa — deliver 37% carbon savings and 20% cost reduction to brands while diverting 2.84 million cartons from landfill. Bio-based alternatives, including BIOND FR A2 plant-based vinyl films (up to 85% biodegradable, GREENGUARD GOLD certified), offer permanent, removable, and repositionable options that match the performance of traditional PVC. PVC-free graphic films — such as Cosmo Films’ Green Graphics portfolio launched at InStore Asia 2026 — provide indoor and outdoor durability equivalent to conventional materials while being fully recyclable.
Digital-Physical Hybrid Approaches
The most forward-looking approach combines the cost advantages of recyclable physical structures with the dynamic-content capability of compact digital modules. A cardboard totem carrying printed brand graphics, fitted with a small e-paper or LCD unit that displays changing promotional content — this configuration, demonstrated by Glass Media at NRF 2026, separates the structural layer (recyclable after each campaign) from the electronic layer (returned and reused across campaigns). The economics are compelling for FMCG brands running seasonal promotions: the cardboard shell is replaced each cycle at minimal cost, while the electronic module amortizes across six or more campaigns. Eventually, this undercuts the per-cycle cost of a full digital display while delivering the same dynamic-content capability.
This is not a compromise between sustainability and impact — it is a strategic allocation of budget and materials to where each delivers the highest return.
Cost, ROI, and the Business Case for Sustainable Displays
The real cost of a retail display is not the purchase price. It is the total cost across its entire service life — labor for content changes, waste disposal fees, energy consumption, and replacement cycles. When evaluated through a total-cost-of-ownership (TCO) lens, sustainable display solutions consistently outperform their traditional counterparts. But the upfront premium creates a perception problem that this section aims to resolve with numbers.
Upfront Investment vs. Lifecycle Cost — The Real Math
The pattern is consistent across solution types: sustainable options carry a 5–18% upfront price premium but deliver 30–45% lower total cost over a five-year horizon (Samtop Display cost analysis). The comparison table below breaks this down by category:
| Solution Type | Upfront Cost (per store) | Service Life | Annual Operating Cost | 5-Year TCO | Carbon Reduction vs. Traditional |
|---|---|---|---|---|---|
| Traditional paper labels + vinyl graphics | $15K–$30K | 3–12 months (continuous replacement) | $18K–$35K (labor + materials + disposal) | $105K–$205K | Baseline |
| ESL system (10K tags) | $60K–$100K | 5–10 years | $2K–$5K (software + support) | $70K–$125K | 50%+ (zero paper + reduced logistics) |
| Reusable modular fixtures | $25K–$50K | 3–5 years (reconfigurable) | $3K–$8K (cleaning + storage + graphic refresh) | $40K–$90K | 60–80% vs. single-use cardboard |
| Recycled/bio-based materials | $12K–$28K (modest premium over conventional) | 2–5 years | $15K–$30K (similar to conventional) | $87K–$178K | 20–40% (material-dependent) |
The math flips fastest for ESL: the elimination of recurring paper, printing, and labor costs compounds every year, while the hardware is a one-time investment with a 5–10 year lifespan.
Payback Timeline — How Fast Can You Expect Returns?
Payback periods vary by solution type and store format, but the data across multiple vendor and independent analyses converges on a consistent range:
- ESL systems: 12–24 months for a standard grocery store with 10,000–15,000 SKUs. The primary savings drivers are labor reduction (60–90% fewer hours spent on price changes, worth $10,000–$20,000 annually) and paper elimination ($2,000–$5,000 annually) — yielding $13,500–$28,000 in total annual savings per store (CDTech ESL ROI analysis). Large-format stores with frequent dynamic pricing can see payback in as little as 6–12 months.
- Reusable fixture systems: 2–3 campaign cycles, typically 12–18 months. After the third campaign cycle, the per-use cost drops below that of single-use cardboard displays.
- Material substitution: Immediate — applicable from the next print or fabrication run. No additional upfront investment is required beyond the modest material price difference.
To make this concrete: a 50-store regional supermarket chain in the U.S. investing $1M–$2.5M in ESL deployment can expect $675,000–$1.4M in annual savings. Full payback arrives within 1.5–3 years. Over five years, net cumulative savings reach $2M–$4.5M. The scale effect is powerful — larger chains recover their investment faster because the software and integration costs spread across more locations.
Hidden Savings — What Most ROI Calculators Miss
Three categories of return rarely appear in vendor ROI calculators but matter enormously to the real business outcome:
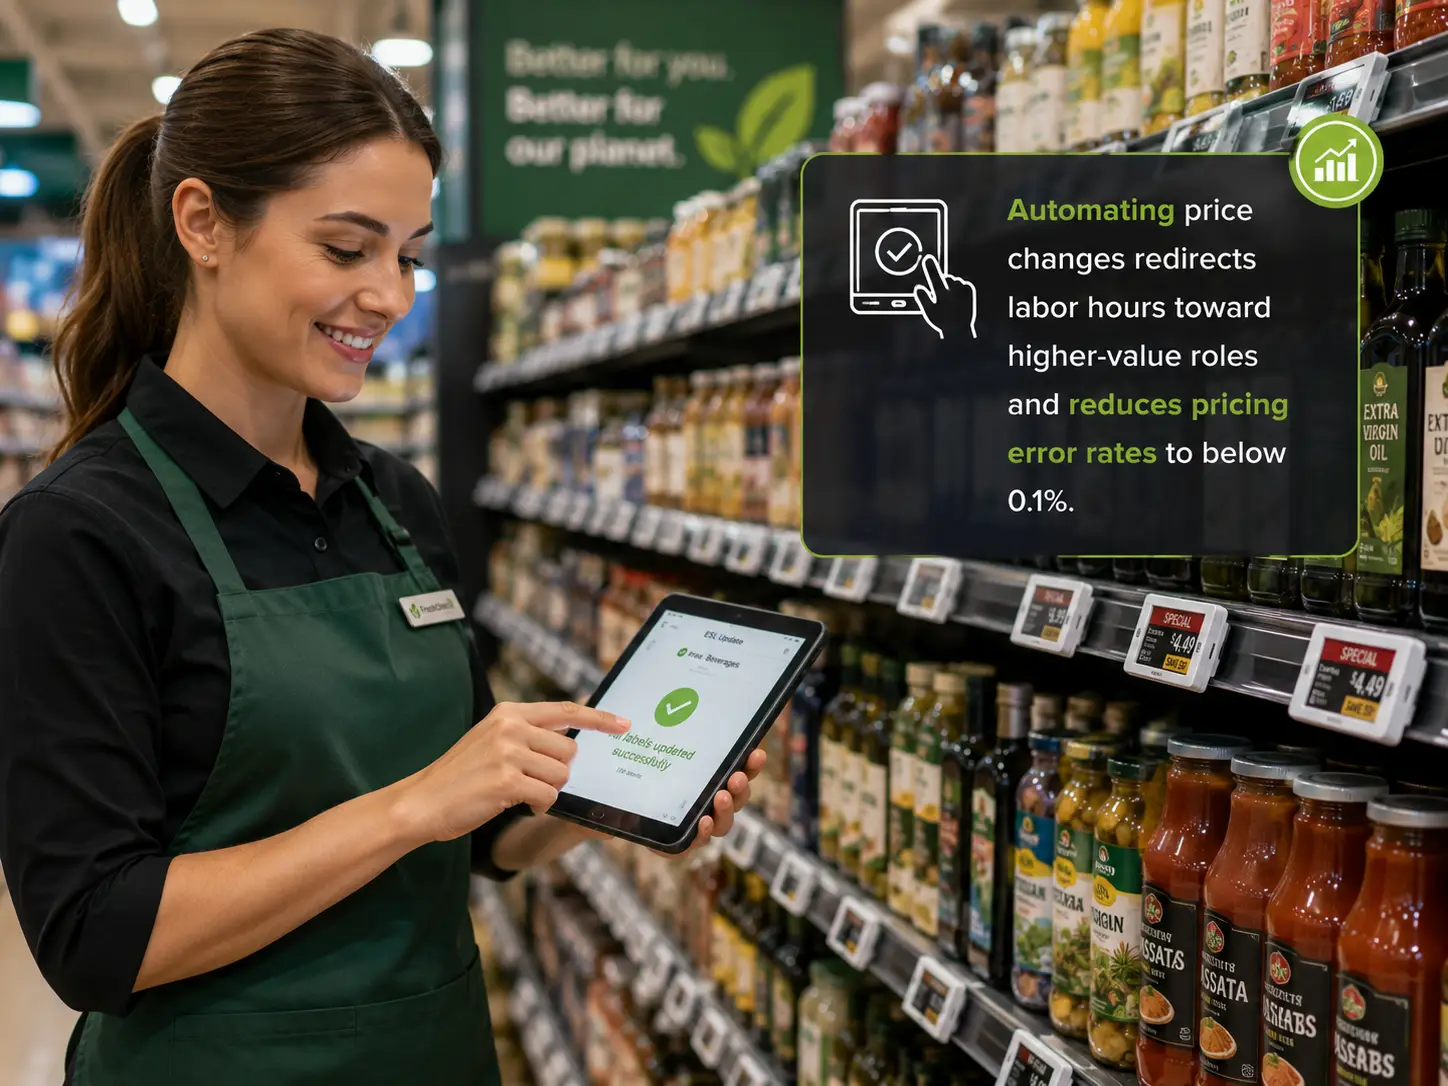
Pricing accuracy. Manual label changes carry an industry-average error rate of 1–3%, rising during peak periods like holiday promotions. Pricing errors not only erode margin — they expose retailers to regulatory fines under consumer protection laws. ESL systems reduce the error rate to below 0.1% by eliminating manual data entry from the pricing workflow.
Staff experience and retention. Replacing a retail employee costs an estimated $3,000–$5,000 in recruitment and training. The repetitive, low-value task of changing paper labels — often performed during late-night or early-morning shifts — contributes to staff dissatisfaction and turnover. Automating this function redirects labor hours toward customer service and merchandising, roles with higher job satisfaction and direct revenue impact.
Compliance pre-positioning. Retailers who adopt reusable and recyclable display systems today are already aligned with PPWR requirements that become binding in 2026 and tighten through 2030. Competitors who delay will face a compressed procurement and deployment timeline, likely at higher cost, with fewer vendor options available.
ROI calculators tell you whether a solution can save money. Hidden savings tell you whether it is worth doing. The answer, across all three categories, is consistently yes.
How to Choose and Implement the Right Sustainable Display Solution
Choosing a sustainable display solution is not about picking the “greenest” option — it is about finding the right fit for your retail format, budget, operational reality, and sustainability goals. This section provides a decision framework, an implementation roadmap, and a measurement system to move from evaluation to execution.
A Decision Framework — Matching Solutions to Retail Scenarios
Different retail formats have fundamentally different display needs. The matrix below maps each major retail scenario to its best-fit sustainable solution:
| Retail Format | Primary Recommendation | Secondary Consideration | Key Factor Driving the Decision |
|---|---|---|---|
| Supermarket / hypermarket (100+ SKUs, frequent price changes) | ESL + e-paper posters | Reusable end-cap fixtures | High label volume + frequent price updates make labor automation the priority |
| Pharmacy / convenience chain (50–100 stores) | ESL system | Bio-based materials for fixtures | Medium scale with rapid deployment need — ESL offers fastest payback at this size |
| FMCG / seasonal promotions | Reusable modular fixture systems | Digital-physical hybrid | Multi-campaign reuse with brand-switching flexibility is the core requirement |
| Premium boutique / department store | Recycled and bio-based materials | E-paper posters for window displays | Brand aesthetics and material narrative value take priority over pure cost optimization |
| Warehouse / logistics | ESL + e-paper labels | Reusable trays and containers | Real-time inventory tracking and paperless picking drive the business case |
Once you have identified your most likely fit, the decision process follows three steps:
- Audit your current state. Map every display type in your stores — shelf labels, promotional signage, end caps, window displays, fixture systems. For each, quantify: how often is content changed? How many labor hours per change? What materials are consumed annually? What is the disposal cost?
- Match to solution types. Using the matrix above, identify which solution category addresses your largest cost and waste drivers first. Start with the highest-impact, fastest-payback category rather than attempting a store-wide overhaul.
- Evaluate suppliers. For ESL vendors, check protocol compatibility with your existing IT infrastructure, software openness (API/SDK availability), deployment scale flexibility (can they handle 100 tags or 10,000?), and certification coverage (CE, ISO 9001, RoHS at minimum). For fixture and material suppliers, request lifecycle analysis data and third-party certification documentation.
Implementation Roadmap — From Pilot to Scale
The most common mistake in sustainable display adoption is skipping the pilot phase and deploying at scale immediately. A phased approach consistently produces better outcomes:
Phase 1 — Audit and Prioritize (1–2 weeks). Complete the current-state audit described above. Select 1–3 pilot stores that represent your typical format — not your flagship, not your smallest outlier.
Phase 2 — Pilot (1–3 months). Deploy the selected solution in your pilot stores. Collect baseline data before deployment and comparison data during: labor hours, error rates, customer feedback, staff feedback, actual versus projected energy consumption. The pilot is where you identify integration friction — POS system compatibility, WiFi coverage gaps, staff training needs — in a controlled environment.
Phase 3 — Evaluate and Refine (1 month). Compare pilot data against baseline. Adjust deployment parameters: tag count per store, fixture configuration, material specifications. Build the adjusted rollout plan with refined cost projections.
Phase 4 — Rollout (3–12 months). Deploy in phases, starting with stores most similar to your successful pilot. Establish a monitoring cadence — weekly during the first month post-deployment, monthly thereafter. The phased approach recommended by vendors like VusionGroup (12–24 months for full chain deployment) reflects real-world experience: IT integration, staff training, and supply chain alignment each have their own timeline. Compressing them creates unnecessary risk.
Common pitfalls to avoid: underestimating the IT integration effort (WiFi coverage, POS system compatibility, cloud platform configuration each need dedicated testing), skipping staff training (the best display system fails if store teams don’t know how to use it), and selecting a vendor based on hardware price alone (software quality, protocol openness, and post-sale support determine long-term success).
Measuring Success — KPIs That Matter
The best sustainable display solution is the one that gets used and optimized continuously. Establish these KPIs from Day One:
Environmental KPIs: Paper reduced (tons/year), carbon emissions reduced (tons CO₂e), waste diverted from landfill (tons/year). These metrics serve both internal accountability and external reporting — they become the data behind your sustainability claims.
Operational KPIs: Labor hours saved on price changes and display setup (hours/year), pricing error rate (%), speed of price update propagation (minutes from decision to in-store execution).
Commercial KPIs: Sales uplift attributable to improved display execution (%), customer satisfaction scores, staff retention rate in store operations roles.
Industry benchmarks provide a starting point: after ESL deployment, pricing error rates typically fall from 1–3% to below 0.1%, and labor hours for price management drop 60–90%. Your pilot data will refine these benchmarks for your specific format and market. ISO 14001 provides a structured framework for integrating environmental performance measurement into ongoing operations — worth adopting if you plan to scale sustainable practices beyond displays.
The retailers who extract the most value from sustainable display investments are not the ones who deploy the most technology. They are the ones who measure, learn, and refine — treating the first deployment as the beginning of a continuous improvement cycle, not the end of a procurement project.
Regardless of which solution path fits your retail operation, the critical factor is finding a partner with the manufacturing depth, certification coverage, and post-deployment support to see the implementation through. Companies like Zhsunyco® — with 41,500+ store deployments across 180 countries and 400+ retailer relationships — demonstrate the scale and reliability that sustainable display adoption demands. To explore custom ESL and e-paper solutions tailored to your store format, reach out for a consultation.
References
- European Commission. “Regulation (EU) 2025/40 — Packaging and Packaging Waste Regulation.” 2025. https://eur-lex.europa.eu/eli/reg/2025/40
- EuroShop Trade Fair. “New EU Packaging Regulation PPWR 2025.” 2025. https://www.euroshop-tradefair.com/en/media-news/euroshopmag/food-service-equipment/new-eu-packaging-regulation-ppwr-2025-for-food-service-providers-and-food-retailers
- CDTech. “How Much ROI Do Digital Shelf Labels Deliver by Cutting Paper Waste?” 2026. https://www.cdtech-lcd.com/news/how-much-roi-do-digital-shelf-labels-deliver-by-cutting-paper-waste.html
- Samtop Display. “Is Sustainability in Retail Displays Worth the Extra Cost?” 2025. https://www.samtop.com/sustainable-retail-display-cost-analysis/
- Economics of Mutuality Alliance. “How Mars and Coles Innovated Retail Displays Through the Lens of Mutual Value Creation.” https://eom.org/knowledge-hub-content/how-mars-and-coles-innovated-retail-displays-through-the-lens-of-mutual-value-creation
- invidis. “NRF 2026: Sustainability Through the Backdoor.” 2026. https://invidis.com/news/2026/01/nrf-2026-sustainability-through-the-backdoor/
- invidis. “Praevar’s 2025/26 Review: Ralph Idems on Why Sustainability Is Still a Business Factor in Digital Signage.” 2025. https://invidis.com/sixteen-nine/2025/12/15/praevars-2025-26-review-ralph-idems-on-why-sustainabality-is-still-a-business-factor-in-digital-signage/
- IW Technologies. “ROI of Electronic Shelf Labels for Retail.” https://www.weareiw.com/blog/roi-electronic-shelf-labels-retail/
- Campaign Ad Net Zero Awards. “PolyAL Display — Barrows Global.” https://www.campaignadnetzeroawards.com/finalists/polyal-display-y0007
- Zhsunyco. “Electronic Shelf Labels (ESL).” https://www.zhsunyco.com/esl/
- Zhsunyco. “Quality Assurance.” https://www.zhsunyco.com/quality-assurance/
- Zhsunyco. “Contact Us.” https://www.zhsunyco.com/contact-us/
- Zhsunyco. “Homepage.” https://www.zhsunyco.com/
