
End Cap Display Ideas: Creative Strategies for Retail That Actually Move Product
01 What Makes an End Cap Display Worth the Investment
Walk into any supermarket and your eyes land on the aisle ends before anything else. That’s not an accident — it’s retail physics. The end cap is the single most valuable square footage in a physical store, and the numbers back this up. Research published in the Journal of Operations Management found that moving a product from standard shelf placement to an end cap delivers a 27% sales lift on average. Meanwhile, the Path to Purchase Institute reports that 37% of consumers notice end-of-aisle displays more than any other in-store fixture.
(Journal of Operations Management)
(Path to Purchase Institute)
Why does this matter? Because end caps operate on three levels at once. First, they command visibility — positioned at natural traffic intersections where shoppers pause, scan, and decide which aisle to enter next. Second, they trigger impulse purchases by placing products outside the structured aisle flow, where shoppers are in decision mode rather than search mode. Third, they act as promotional amplifiers — a seasonal deal on a standard shelf is a footnote; the same deal on an end cap is an event.
Think of the end cap as your store’s last 30 seconds of a shopper’s journey down any given aisle. It’s your final chance to stop them, interest them, and convert passive browsing into an active purchase. The question isn’t whether end caps are worth investing in. It’s whether you’re using them to their full potential.
02 Core Design Principles for End Caps That Stop Traffic
Effective end cap design isn’t about making things “look nice.” It’s about controlling a shopper’s visual processing path: color captures attention, text delivers information, and layout guides action. Each of these three layers needs deliberate engineering.
Visual Hierarchy — Color, Lighting, and Focal Points
Color does the heavy lifting in the first three seconds. Research from Straits Research shows that strategic color use increases brand recognition by 80%, which means your end cap’s color choices aren’t decorative — they’re navigational. Red signals urgency and works for clearance and limited-time offers. Green communicates freshness and decision ease, making it ideal for grocery and natural products. Orange triggers impulsiveness — the reason snack brands have dominated end caps for decades.
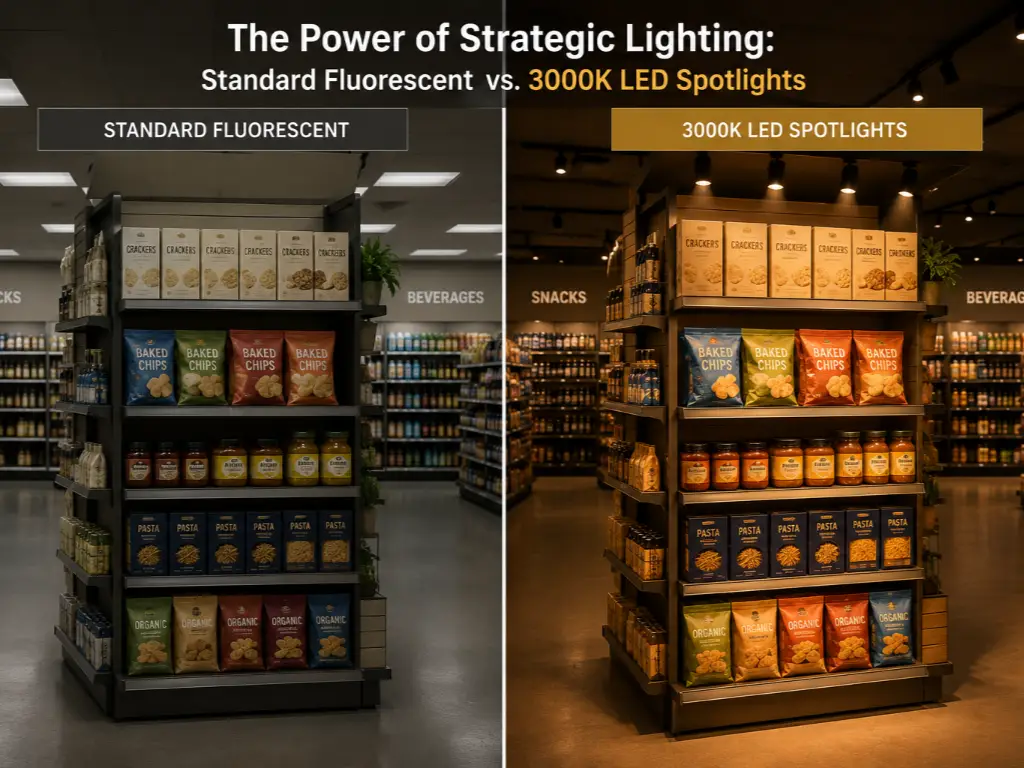
Lighting is where most retailers underinvest. A standard fluorescent-lit end cap blends into a sea of identical brightness. Adding directional LED spotlights — even a single focused fixture — creates a 3:1 brightness ratio between your display and the surrounding shelves. That’s the point where shoppers actually register something as highlighted rather than just “more of the same.” For premium or brand-showcase end caps, LED lightboxes at around 3000K (warm white) make food and lifestyle products feel inviting; 4000K (cool white) suits electronics and hardware, where precision perception matters.
The focal point rule is simple but non-negotiable: one hero product at eye level, supported by secondary items above and below. Shoppers should know what this end cap is “about” within 1.5 seconds — the same time they’d have to read a billboard from a moving car.
Signage That Sells — Messaging, Pricing, and Calls to Action
Once color stops the shopper, signage closes the deal. The most reliable framework is the end cap “thirds” rule: the top third carries your theme or brand message, the middle third houses pricing and the core value proposition, and the bottom third holds the call to action.
Pricing presentation deserves more attention than it gets. Displaying a strikethrough original price next to the sale price triggers what behavioral economists call the anchoring effect — the brain interprets the sale price as a gain relative to the anchor. But a sale price shown alone, without context, loses roughly half its perceived value. The difference between “$12.99” and “Was $18.99 / Now $12.99” on an end cap isn’t just more information. It’s a different conversion rate entirely.
Readability from distance is the test most end cap signage fails. A reliable formula: each inch of letter height translates to roughly 25 feet of legibility. If your end cap sits at the back of a 40-foot aisle, your main message needs letters at least 1.5 inches tall. Stand 10 feet away and squint — if you can’t read it, neither can your customers.
Placement & Product Accessibility — The Science of Shelf Positioning
The adage “eye level is buy level” has a specific measurement behind it: the optimal product placement zone sits between 54 and 64 inches from the floor — the natural sightline of an average adult scanning horizontally. Products in this zone consistently outsell those on top or bottom shelves by a factor of two to three.
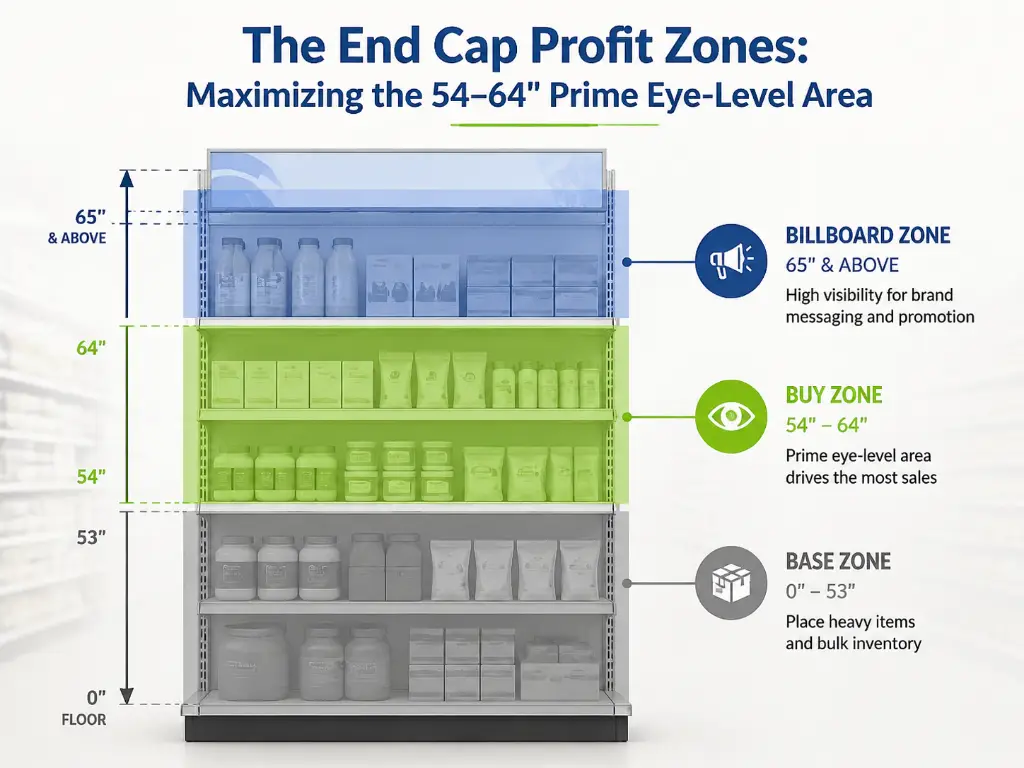
Weight distribution follows a practical logic: heavy or bulk items on the bottom shelf prevent the display from feeling top-heavy and make restocking safer. Lighter, higher-margin impulse items earn the prime middle band. The top shelf works best for oversized “billboard” packaging that draws attention from across the store — shoppers see the large format from a distance and walk closer to investigate.
One often-overlooked factor: facing count. Each additional product facing — the number of identical units shown front-forward — increases the probability of purchase. For end caps, the sweet spot is three to five facings of the hero SKU, enough to signal availability without wasting premium real estate on redundant units.
03 Seasonal & Thematic End Cap Ideas That Create Urgency
Seasonal end caps don’t just “feel festive.” They manufacture time scarcity — one of the strongest purchase motivators in retail. A well-executed seasonal strategy turns advance planning, theme selection, and narrative storytelling into a repeatable system rather than a quarterly scramble.
The Seasonal Rotation Calendar — When to Refresh Your End Caps
Retailers who treat seasonal rotations as a reactive rush leave money on the table. The pattern is clear: grocery end caps should refresh every 2 to 4 weeks, while specialty retail can stretch to 4 to 8 weeks depending on product category and foot traffic patterns. The planning cycle needs to start 2 to 3 months before the target season. Christmas end caps designed in October outperform those thrown together in late November every single time.
Key launch windows by season: Christmas and holiday themes should hit the floor the first week of November, not after Thanksgiving. Back-to-school end caps need to appear by the third week of July, capturing the early-August planning surge. Valentine’s Day displays that go up in mid-January capture both the early planners and the last-minute rush. Spring and summer themes follow a gentler curve — March for gardening, May for outdoor entertaining, June for travel and beach categories.
Holiday & Event-Based Themes That Drive Impulse Purchases
Different holidays unlock different spending psychology, and your end cap strategy should match. Christmas end caps consistently deliver the strongest lift — 35 to 50% above baseline — when they combine giftable products with stocking-stuffer impulse items at the front. Super Bowl displays drive a 20 to 30% lift by clustering chips, dips, beverages, and disposable serveware into a single “game day headquarters” proposition. Valentine’s Day end caps earn 25 to 40% lifts, especially when they pair premium confectionery with adjacent categories like wine, flowers, or greeting cards within arm’s reach.
An often-missed opportunity: counter-intuitive color schemes. A Christmas end cap in champagne white and brushed gold stands out sharply in a sea of red-and-green and signals premium gifting rather than discount stocking stuffers. The same principle applies across holidays — deviation from visual clichés within a familiar theme reads as “curated” rather than “generic.”
Storytelling Through Themed Merchandising
The most memorable end caps don’t just display products. They build scenes. A camping end cap at REI that places a tent, sleeping bags, a camp stove, a lantern, and a French press coffee maker together isn’t selling seven separate items. It’s selling “Saturday morning at the campsite.” This narrative approach increases dwell time by 15 to 25% compared to purely promotional end caps, and — more importantly — raises the rate at which shoppers buy two or more associated products from the same display.
Two narrative frameworks work reliably. The lifestyle narrative places products in an aspirational context: “the perfect Sunday breakfast” with artisan bread, premium jam, pour-over coffee, and linen napkins. The problem-solution narrative clusters items around a specific pain point: “cold and flu season survival kit” with medicine, tissues, hand sanitizer, herbal tea, and a reusable water bottle. Both approaches outperform product-category dumps for one reason — they answer the question every shopper is silently asking: “What do I actually do with this?”
04 Cross-Merchandising Strategies That Boost Basket Size
Cross-merchandising pairs products that belong together but live in different aisles. The logic is straightforward: you’re not selling individual products — you’re selling ready-made solutions. Data from market basket analysis consistently shows cross-merchandised end caps increasing average transaction value by 18 to 30% compared to single-category displays.
| Scenario | Hero Product | Complementary Items | The Logic |
|---|---|---|---|
| Pasta Night | Premium Pasta | Sauce + Parmesan + Garlic Bread | Complete dinner in one stop |
| Home Coffee Bar | Coffee Maker | Whole Beans + Mugs + Creamer | The full café experience |
| Cold & Flu Season | Cold Medicine | Tissues + Sanitizer + Herbal Tea | Health recovery kit |
| BBQ Weekend | Grill Tools Set | Marinade + Charcoal + Tongs | Ready-to-grill bundle |
| Baking Day | Cake Mix | Frosting + Sprinkles + Baking Pan | Complete baking project |
| Movie Night | Gourmet Popcorn | Candy + Soda + Napkins | Home theater package |
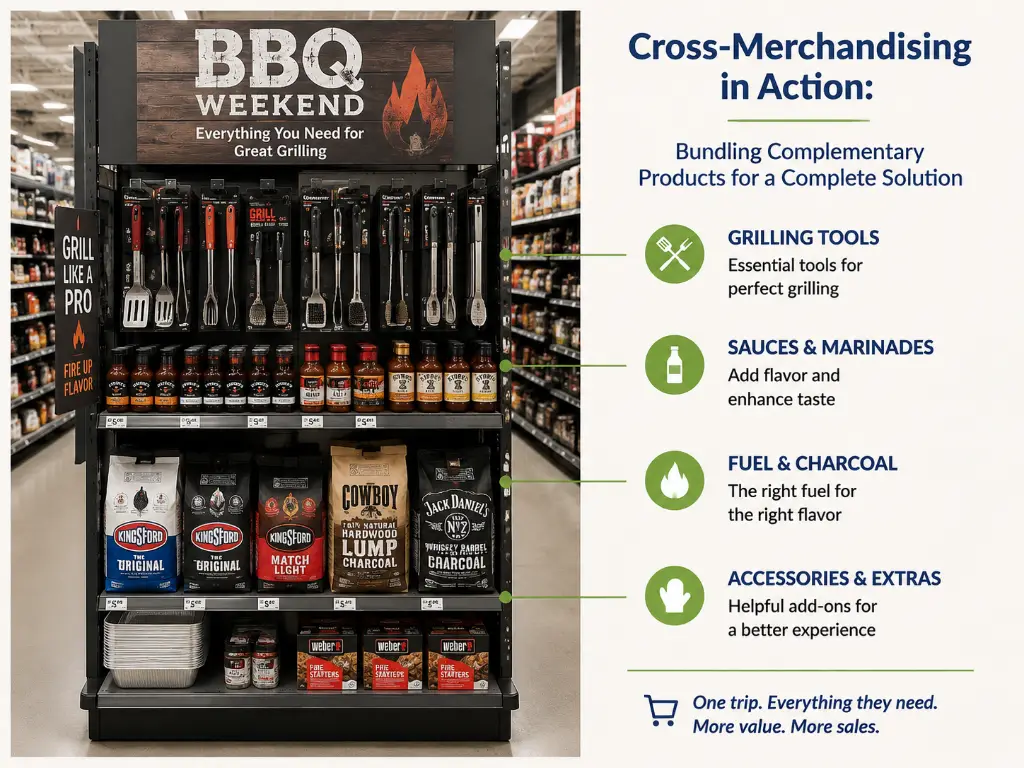
The selection rule is simple: if a shopper needs to read a paragraph to understand why two products sit together, the pairing has already failed. The best cross-merchandised end caps communicate their logic in a single glance.
05 The Digital End Cap — Smart Technology Meets Aisle-End Merchandising
Here’s an uncomfortable truth most end cap advice ignores: the biggest limitation of traditional end caps isn’t design. It’s speed. When a 50-store supermarket chain runs a weekend promotion, updating every end cap’s paper price tags takes 2 to 4 person-hours per store. By the time the last store is updated, the promotion window is already closing. Price errors — averaging 2 to 4% in paper-based retail environments — generate customer complaints, trigger compliance fines in regulated categories, and erode trust in ways no amount of clever signage can fix.
The retailers pulling ahead aren’t just designing better static end caps. They’re making them digital.
Why Static End Caps Are Losing the Race — The Case for Digital Transformation
Let’s put numbers to the pain. For a mid-size chain with 50 locations, changing end cap pricing for a single weekend promotion conservatively costs 100 to 200 labor hours. That’s before accounting for the tags that get missed, the prices that ring up wrong at checkout, and the promotions that launch late because staff couldn’t physically reach every store in time. Kroger recognized this bottleneck and deployed their EDGE (Enhanced Display for Grocery Environment) digital shelf system across more than 120 stores. Cloud-connected displays now update end cap pricing, nutritional data, and promotional messaging across all locations simultaneously.
- 100–200 labor hours per promotion — one 50-store chain, one weekend, just for end cap price tags
- 2–4% price error rate in paper-based retail — every error is a customer complaint or a compliance risk
- Promotional latency — staff can’t physically reach every store in time. Promotions launch late or not at all.
The ROI equation for digital end caps is straightforward: labor savings from eliminated manual tag changes, plus revenue gains from 100% price accuracy at checkout, plus promotional revenue from the ability to run flash sales and time-of-day pricing that static displays physically cannot support. Industry data suggests the typical payback period for electronic shelf label (ESL) systems lands between 12 and 18 months — shorter for high-promotion-volume retailers.
ESL & Dynamic Pricing — The Engine Behind Smart End Caps
Electronic shelf labels designed for end cap use differ from standard shelf-edge tags in important ways. End cap ESLs are typically larger format — 4.2 to 7.5 inches and above — because they need to be readable from across an aisle, not just from two feet away. Four-color display technology (black, white, red, and yellow) enables promotional highlighting directly on the tag, eliminating the need for separate “SALE” stickers that inevitably peel, fade, or get applied crooked. Advanced models support MQTT protocol communication, which means the ESL system can talk directly to the store’s POS and inventory management software — when stock drops below a threshold, the end cap price adjusts automatically without anyone touching a single tag.
For retailers evaluating the transition, the practical path is rarely “rip and replace.” Most successful deployments start with a pilot on high-traffic end caps — the ones that change promotions most frequently — and expand from there based on measured results. A single end cap pilot lets the operations team learn the software workflow, train staff, and quantify the labor savings before committing to a broader rollout.
For retail chains exploring the shift, manufacturers like Zhsunyco® — ranked among China’s top three ESL producers and serving over 41,500 stores across 180 countries — have developed end-cap-specific ESL solutions that integrate 2.4GHz wireless communication, four-color E-Ink displays with 5-to-10-year battery life, and cloud-based management software supporting multi-store synchronization from a single dashboard. The company’s one-time software licensing model with lifetime free updates removes the recurring SaaS cost that often surprises retailers during ESL budgeting. (Explore 2.4GHz electronic shelf labels for retail)
Real-World Examples — Retailers Already Winning With Digital End Caps
Kroger’s EDGE deployment is the most visible U.S. example, but the trend is global. European grocery chains including Carrefour and Intermarché have rolled out digital shelf labels across hundreds of locations, with end cap displays receiving the largest-format units for maximum promotional impact. In the pharmacy sector, chains are using digital end cap tags to ensure prescription-area pricing matches checkout pricing exactly — a compliance requirement that paper tags struggle to meet consistently.
What these early adopters share isn’t just a technology budget. It’s a recognition that end caps are too valuable to leave stranded in the paper era. When your competitors can update end cap pricing across 500 stores in under 60 seconds while your team is still printing labels for store #3, the competitive gap isn’t about design creativity anymore. It’s about operational speed.
06 Measuring End Cap Performance & Keeping Displays Fresh
Even the best end cap design eventually goes stale. Shoppers who visit your store weekly stop noticing displays that never change — it’s the retail equivalent of banner blindness online. The rule of thumb: if an end cap’s weekly sales have dropped 15% or more from its peak, it’s time for a refresh.
Measurement doesn’t need to be complex. Track three numbers: sales lift versus the product’s standard shelf performance (compare the two weeks before and after end cap placement), dwell time (an end cap averaging 5 to 8 seconds of shopper attention is performing well; standard shelf fixtures average 2 to 3 seconds), and promotional conversion rate — the percentage of shoppers who pause at the end cap and ultimately place a product in their cart.
Treat your end caps the way a media buyer treats billboard placements: test variations, measure results, rotate underperformers, and double down on what works. An end cap is your store’s most valuable advertising space. You wouldn’t run the same ad for a year — don’t run the same end cap for a season.
References: Journal of Operations Management (DOI: 10.1016/j.jom.2018.06.002) · Path to Purchase Institute (p2pi.org) · Straits Research (straitsresearch.com) · Microsoft Transform — Kroger EDGE (news.microsoft.com) · ZhSunyco® (zhsunyco.com)
