
In the world of modern inventory management, inventory is not merely an asset; it is often a liability. Traditionally, retailers believed a broader product assortment of inventory led to a higher revenue capture; this is no longer true. With profit margins shrinking and supply chain costs rising, the “endless aisle” approach results in operational paralysis.
This document puts forth a framework of structure and detail on how to approach SKU rationalization from an execution standpoint. We will cover the theory, the rationalization process, granular detail of sales data analysis, and decision frameworks, as well as the often-neglected physical execution at the shelf edge, all in great detail to improve your bottom line.
What is SKU Rationalization?
There is a pervasive misconception that SKU rationalization is simply a cost-cutting exercise or a “cleanup” of the warehouse. This view is reductive and dangerous.
SKU Rationalization is the strategic reallocation of inventory capital.
Every dollar tied up in low-margin, slow-moving products is a dollar that could otherwise be invested in higher-performing assets, new product innovation, or customer acquisition. This is not a process of merely subtraction but liquidity. The goal of SKU rationalization is to free the cash locked in “dead stock” and redeploy it to segments where it will move and be more productive.
The SKU rationalization process—analyzing each stock keeping unit (often identified by a unique code)—when done correctly, does not contract the business. Rather, it increases revenue density per square foot and enhances the supply chain’s overall health. The focus shifts from “selling more things” to meeting business goals by “selling more of the right things” to improve cash flow.
Signs You Need a SKU Audit Now
In a stable economic environment, bloated inventory is a nuisance. In today’s volatile market conditions, it is a systemic risk. Supply chain fluctuations, labor shortages, and changing consumer demand have made inventory optimization the primary indicator of survival.
The following conditions experienced by your organization call for an immediate audit to cut costs and improve business performance:
- Warehouse Overflowing
When a distribution center surpasses an 85% fill rate, it becomes highly inefficient. Lead times for pick-pack-ship processes increase, error rates rise, and safety risks heighten. A lack of timely legacy product withdrawals, leading to limited placement of incoming, highly demanded, fast-moving products in the rack systems, impedes operational efficiency.

- High Carrying Costs
Most retailers only look at the purchase cost of the goods without considering the Total Cost of Ownership (TCO). Inventory costs are not just the freight costs, but the expense of holding inventory over time. This also includes storage costs, insurance, shrinkage (theft or damage), and overhead costs. Present estimations suggest that carrying costs are somewhere between 20% to 30% of the inventory value every year. If you have kept a slow-moving item for an entire year, you have most likely eroded all of its profit margin.
- Declining GMROI
Gross Margin Return on Investment (GMROI) is the ultimate truth-teller in retail. It answers a simple question: For every dollar invested in inventory levels, how many dollars of gross margin did we get back?
If revenue is growing or staying flat but GMROI is declining, it shows that you are buying sales at an inefficient rate. You are most likely holding ‘lazy inventory.’ This inventory performance gap means products have just enough sales to be on the order sheet but not enough sales to justify the capital value of holding the stock.
The 5-Step Process
Successful rationalization is not emotional; it is data-driven. It is a process that must be framed rigorously via data collection in order to be free of perceived value and focus on actual SKU performance.
Step 1: Data Collection (COGS, Velocity, Margin)
The quality of your decision is only as good as the quality of your data. Before making any decisions, you must aggregate historical sales data from disparate silos—POS systems, warehouse management systems (WMS), and supplier databases.
You need a unified view of the following metrics for every single SKU in your product catalog:
| Metric | التعريف | Why It Matters for Rationalization |
| COGS (Cost of Goods Sold) | The total cost to acquire inventory, ensuring “landed costs” are included (tariffs, freight to DC). | Basing decisions on supplier invoice price alone hides the true cost of inventory. |
| Sales Velocity | The sales volume per specific time period (week/month). | Quickly identifies “fast movers” vs. “shelf warmers” that occupy valuable space. |
| Gross Margin | The actual dollar profit generated per unit sold (Revenue – COGS). | High velocity is meaningless if the profit per unit is negligible or negative. |
| Return Rate | The percentage of sold units that are returned by customers. | A high-velocity item with a 40% return rate is not a winner; it is a logistical drain on inventory control. |
Step 2: The Pareto Analysis (80/20 Rule)
Implement the Pareto Principle on your dataset. In almost every retail case, around 20% of the SKU produces 80% of the profit. On the flip side, the (90%) long-tail SKU produces, in most cases, 20% of the profit.
Identify the top 20%. These are your “sacred” SKUs. The goal of this audit is to ruthlessly evaluate the remaining 80%, specifically the underperforming SKUs.
Step 3: Categorization (Keep, Retool, Retire)
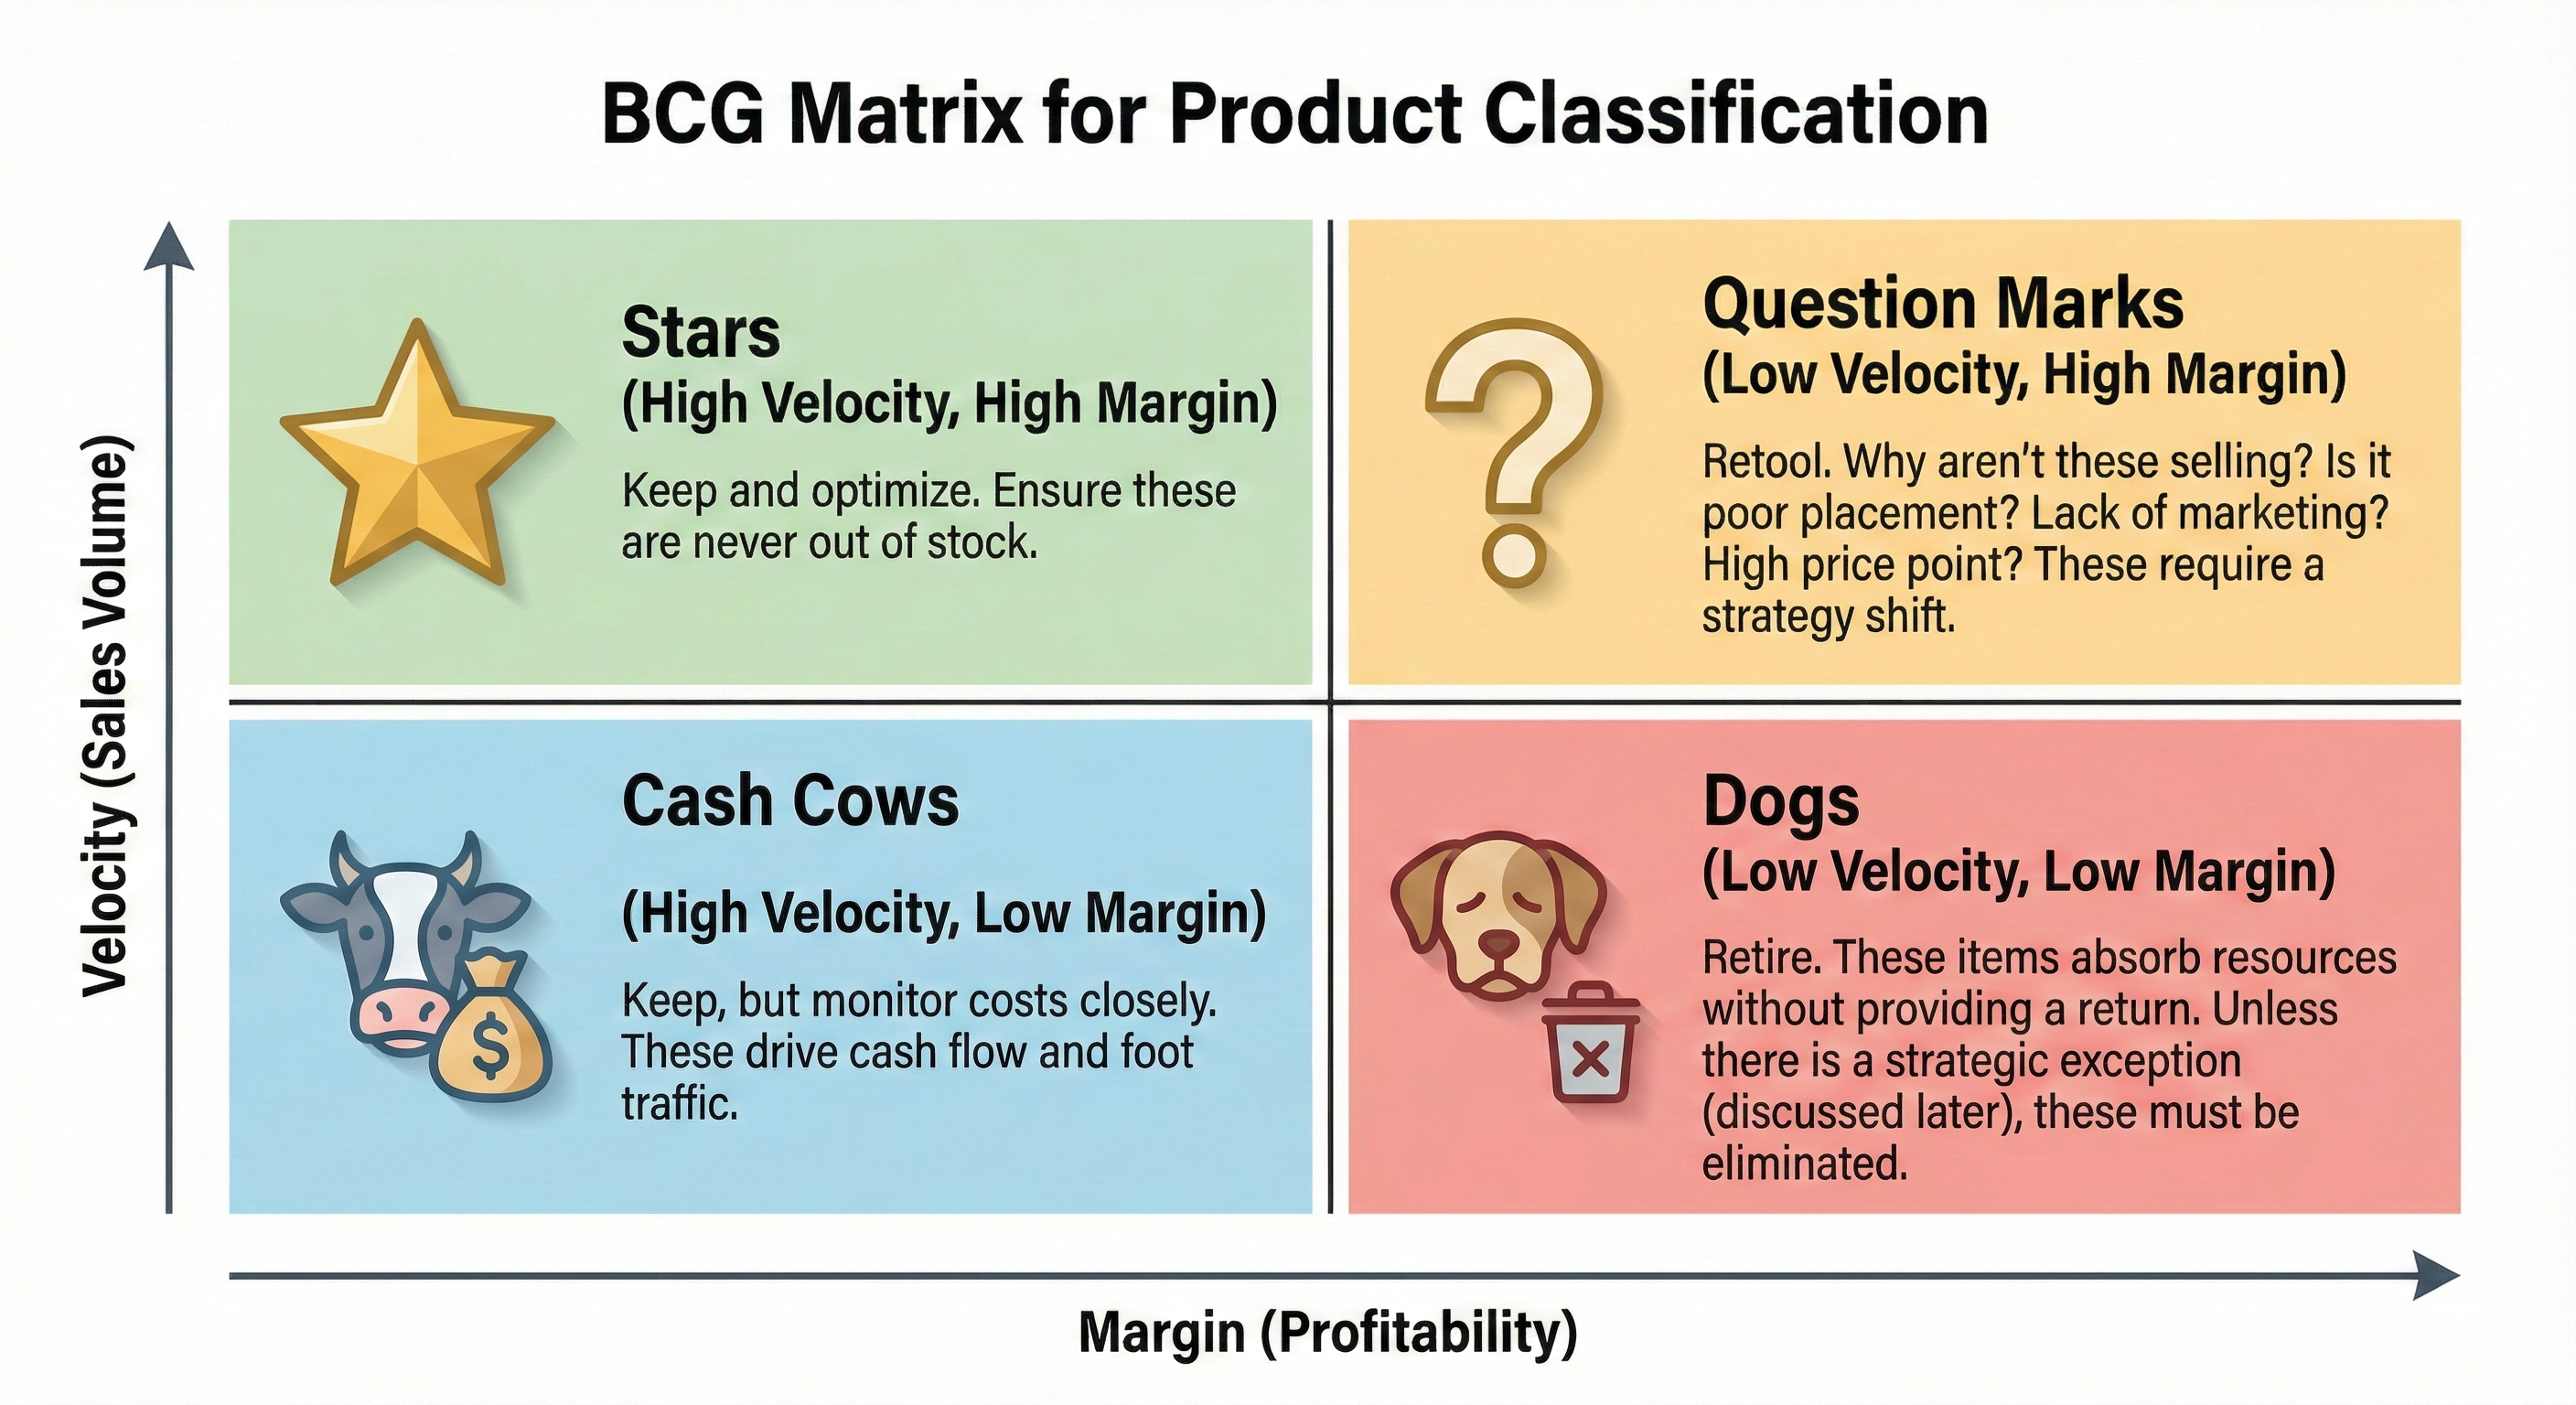
After data segmentation, use a matrix to plot your product portfolio like the BCG Matrix. This is to help you make decisions on sales trends:
- Stars (High Velocity, High Margin): Keep and optimize. Ensure these are never out of stock.
- Cash Cows (High Velocity, Low Margin): Keep, but monitor costs closely. These drive cash flow and foot traffic.
- Question Marks (Low Velocity, High Margin): Retool. Why aren’t these selling? Is it poor placement? Lack of marketing efforts? High price point? These require a SKU strategy shift.
- Dogs (Low Velocity, Low Margin): Retire. These items absorb resources without providing a return. Unless there is a strategic exception (discussed later), these product offerings must be eliminated.
Step 4: Disposition & Exit Planning
Deciding to stop selling a certain product is the easy part. The more complicated part is to remove the excess inventory without any financial hits. This phase is mostly about organization and logistics.
- RTV (Return to Vendor): Check your vendor agreements. Are there buy-back clauses? Can you exchange slow-moving inventory for credit towards “Star” products?
- Consolidation: Rather than having 3 pieces of a “Dog” SKU in 500 stores, concentrate them in a regional location or a designated clearance center. This allows you to immediately clear the key selling locations.
- Liquidation: Sell excess inventory in large quantities to third-party liquidators. While you might take a loss in the cost of goods sold, you will quickly gain cash and will clear out warehouse space. Rather than a slow sales bleed, this is often the better option.
Step 5: Governance & New Product Introduction (NPI)
The most common oversight in rationalization is the virtue of “SKU Creep.” In the absence of SKU management governance, there will be an approximate, inevitable explosion in the number of SKUs again after 18 months.
- The “Gatekeeper” Protocol: New SKUs require strict governance in the flow for approval to add new items. Purchasers need to justify new items with a product lifecycle estimate. Also, a “One-in, One-out” policy should be implemented to control product lines. For example, if a new brand of pasta sauce is added, a brand of pasta sauce that is older should be removed, or at least reviewed for removal.
- Sunset Clause: Each new SKU should be added to the system with a probationary period (e.g., 6 months). In the event that the SKU does not earn retirement by triggering a “Retire” flow after 6 months KPIs of velocity and margin.
The Hidden Challenge: Why most strategies fail during implementation
Retailers are excellent at Step 1 through Step 3 (Analysis). They often fail at the point of physical execution. A spreadsheet can be changed in seconds; a physical store requires labor, coordination, and time.
The “Aftermath” Strategy: Managing the Inventory Exit
It’s easy to assume that removing a SKU from the system means that the boxes containing that SKU will cease to exist, but this is not the case. An excessive loss to control the exit strategy is, in most cases, not a wise brand strategy. How can we execute an exit that is balanced along the vectors of cash-optimized recovery and brand identity exit strategies?
- The “Opaque” Channel الاستراتيجية: Before cutting your prices and putting a red sticker on your shelf, you should consider what “opaque” channels can result in. Such channels involve selling your inventory on flash-sale sites or through mystery boxes or discount secondary retailers like TJ Maxx, where the price depreciation can not easily be associated with your core competitors. This clear volume without setting a low price precedent in your flagship.
- Strategic Bundling (The “Kit” Approach): Rather than discounting a slow-moving item by 50%, bundle it with a high-velocity “Star” product. For example, a slow-selling specialty lens cloth can be bundled with a best-selling camera lens. You maintain the price point of the hero product while clearing the liability, catering to customer demand. The customer perceives added value, not a clearance sale.
- Progressive Markdown Cadence: If you really have to mark down in-store, automate at least the pain of the decision. Set a hard ’30-50-70′ rule: after two weeks, mark down to 30% off, after another 2 weeks, 50% off for 2 weeks, then 70% off or donate. Don’t let ‘zombie inventory’ take up space on the shelf too long, speed is everything.
Counter-intuitive Insights: When a “Loss-Maker” is Essential
It is an empirical world, but consumer behaviour is subjective. Don’t simply delete a “Dog” SKU based on the spreadsheet. Think about the customer needs and the role an item plays.
- Basket Builders (The “Hardware Store” Effect): Picture a particular size screw that is probably near-zero profit and sells slowly. Data suggests “Retire.” However, 85% of customers buying those high-margin power drills also buy that screw. If you remove that screw, the customer is going to the competition for the rest of the project. This SKU isn’t a product; it’s a service accompaniment.
- Loss Leaders: These are high-velocity items priced at or below cost (like milk or diapers) to intentionally drive foot traffic and sales performance. These SKUs ‘ value is measured in visits generated, not margin dollars. Plus, removing it to boost margin saves four to five percent, and that’s really the opposite for gross profit dollars.
- Defensive SKUs: There are also cases when you need to carry a product for no reason other than to defend against a competitor and maintain market trend relevance. For example, you may choose to stock a no-margin entry-level model solely to keep customers from migrating to a competitor’s ecosystem. While these products are just “strategic placeholders” and do not result in profit, they are still valuable because they defend a portion of your market share.
The Hidden Tax: The Labor Cost of Shelf Resets
This is the single biggest friction point in SKU rationalization. When the head office decides to delete 400 SKUs and add 200 new ones, a major “Planogram Reset” is set to happen, impacting supply chain efficiency.
- Staff must find the old products and remove them.
- They must peel off old paper labels and print new ones.
- They must physically rearrange the shelf facings.
- They must update pricing for clearance items.
When this is done using paper labels, this process is excruciatingly slow and error-prone. It often leads to what we call “compliance gaps”, where the shelf is out of synch with the product mix the head office plans.

Technology as an Enabler: How We Bridge the Gap
This is where we at Zhsunyco step in. We understand that SKU rationalization isn’t just a spreadsheet exercise—it’s a physical challenge. We have engineered our Electronic Shelf Label (ESL) solutions specifically to remove the friction between your data analysis and your shelf execution.
- Visualizing Clearance Instantly: With our innovative 4-color E-ink displays (Red/Yellow/Black/White), we empower you to instantly highlight clearance items across all stores. You can turn a price tag red to signal a “Last Chance” offer globally in seconds, driving velocity for “Retire” items without asking your staff to stick a single manual label.
- Seamless Integration: We built our Open ESL base stations with MQTT to speak your language. We integrate directly with your POS and inventory systems, ensuring that when you make a strategic decision at HQ, it reflects on the shelf edge immediately.
- Sustainable العائد على الاستثمار: We believe you shouldn’t be penalized for optimizing your store. Unlike competitors who charge recurring fees, we offer a “pay once, free for life” software model. This ensures that the cost of your technology never eats into the margin gains you achieve through rationalization.
By digitizing the shelf edge, the physical execution of a SKU audit becomes as fluid as the data analysis behind it.
Best Practices to Maintain Efficiency
Rationalization is not a one-time project; it is an operational discipline.
- Regular Reviews (Quarterly)
In modern retail, annual reviews are far too slow. If you find a “Dog” during an annual review, you’ve already incurred 12 months of carrying cost. We need to switch to a quarterly cadence in order to catch declining market demand and consumer preferences sooner.
- Automated Alerts
Set up your inventory management system to automatically flag inventory turnover rates that are low. Management should receive an exception report every week that emphasizes SKUs breaching the safety threshold.
- Cross-departmental Alignment (Sales + Ops + IT)
Friction often comes from the fact that each department has conflicting goals. Sales has a revenue focus (high variety) targeting a broad target audience and target market, while Operations has an efficiency focus (low variety).
It is up to leadership to align these groups around a common goal. For example, Net Profit Contribution. This way, the Sales team is incentivized to win when low-cost sales are to be won, while the Ops team is incentivized to achieve efficiency. A tradeoff for customer loyalty is fine.
Conclusion: A Leaner, Smarter Store
The greatest challenge of warehouse management is reconciling chaos with profitability. SKU rationalization is a bridge that balances the two, but only when the pain of tough decisions is endured, followed by discipline.
Yet the best strategies only work when followed by excellent implementation. When retailers use careful number crunching, combined with modern tools, to get their inventory burdens transformed into streamlined, valuable assets, they perform the best. The performance of each SKU contributes to a store that is cheaper to run, easier to shop, and operates faster.
The outcome of such a solid framework? A store that is cheaper to run, easy to shop, and operates faster in adapting to the ever-changing demands of the marketplace. However, it goes beyond the optimization of operational efficiency. It creates adaptive excellence.
Are you ready to align your shelf edge with your inventory strategy? Discover how our digital labeling solutions can streamline your SKU execution.
